Graficos animados en matlab
Publicado por felipe (13 intervenciones) el 18/01/2017 03:44:31
Hola buenas noches
me mensaje es a raiz de una necesidad surgida, explico
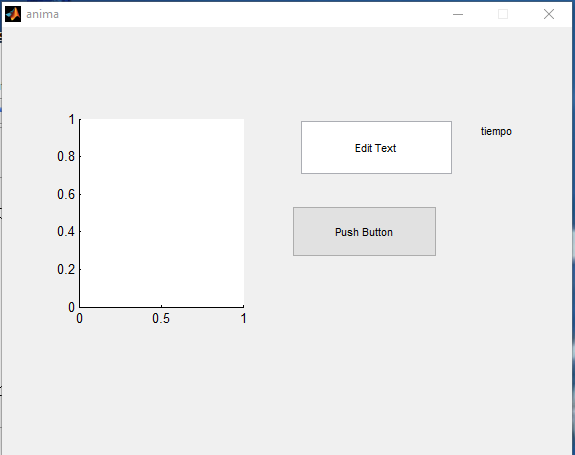
deseo hacer una gui con un axes, edit text y un pushbutton
Quiero que cuando presione el botón se haga una gráfica animada de una función, previamente programada.
he visto 3 tutoriales de como hacerlo, pero nada de como hacerlo con una gui (solo aparecen script sin gui)
>> AJUNTO EL SCRIPT

>>DE antemano muchas gracias :)
me mensaje es a raiz de una necesidad surgida, explico
deseo hacer una gui con un axes, edit text y un pushbutton
Quiero que cuando presione el botón se haga una gráfica animada de una función, previamente programada.
he visto 3 tutoriales de como hacerlo, pero nada de como hacerlo con una gui (solo aparecen script sin gui)
>> AJUNTO EL SCRIPT
1
2
3
4
5
6
7
8
9
10
11
12
13
14
15
16
17
18
19
20
21
22
23
24
25
26
27
28
29
30
31
32
33
34
35
36
37
38
39
40
41
42
43
44
45
46
47
48
49
50
51
52
53
54
55
56
57
58
59
60
61
62
63
64
65
66
67
68
69
70
71
72
73
74
75
76
77
78
79
80
81
82
83
84
85
86
87
88
89
90
91
92
93
94
95
96
97
98
99
100
101
102
103
104
105
106
107
108
109
110
111
112
113
114
115
116
117
118
119
120
121
function varargout = anima(varargin)
% ANIMA MATLAB code for anima.fig
% ANIMA, by itself, creates a new ANIMA or raises the existing
% singleton*.
%
% H = ANIMA returns the handle to a new ANIMA or the handle to
% the existing singleton*.
%
% ANIMA('CALLBACK',hObject,eventData,handles,...) calls the local
% function named CALLBACK in ANIMA.M with the given input arguments.
%
% ANIMA('Property','Value',...) creates a new ANIMA or raises the
% existing singleton*. Starting from the left, property value pairs are
% applied to the GUI before anima_OpeningFcn gets called. An
% unrecognized property name or invalid value makes property application
% stop. All inputs are passed to anima_OpeningFcn via varargin.
%
% *See GUI Options on GUIDE's Tools menu. Choose "GUI allows only one
% instance to run (singleton)".
%
% See also: GUIDE, GUIDATA, GUIHANDLES
% Edit the above text to modify the response to help anima
% Last Modified by GUIDE v2.5 17-Jan-2017 23:38:58
% Begin initialization code - DO NOT EDIT
gui_Singleton = 1;
gui_State = struct('gui_Name', mfilename, ...
'gui_Singleton', gui_Singleton, ...
'gui_OpeningFcn', @anima_OpeningFcn, ...
'gui_OutputFcn', @anima_OutputFcn, ...
'gui_LayoutFcn', [] , ...
'gui_Callback', []);
if nargin && ischar(varargin{1})
gui_State.gui_Callback = str2func(varargin{1});
end
if nargout
[varargout{1:nargout}] = gui_mainfcn(gui_State, varargin{:});
else
gui_mainfcn(gui_State, varargin{:});
end
% End initialization code - DO NOT EDIT
% --- Executes just before anima is made visible.
function anima_OpeningFcn(hObject, eventdata, handles, varargin)
% This function has no output args, see OutputFcn.
% hObject handle to figure
% eventdata reserved - to be defined in a future version of MATLAB
% handles structure with handles and user data (see GUIDATA)
% varargin command line arguments to anima (see VARARGIN)
% Choose default command line output for anima
handles.output = hObject;
% Update handles structure
guidata(hObject, handles);
% UIWAIT makes anima wait for user response (see UIRESUME)
% uiwait(handles.figure1);
% --- Outputs from this function are returned to the command line.
function varargout = anima_OutputFcn(hObject, eventdata, handles)
% varargout cell array for returning output args (see VARARGOUT);
% hObject handle to figure
% eventdata reserved - to be defined in a future version of MATLAB
% handles structure with handles and user data (see GUIDATA)
% Get default command line output from handles structure
varargout{1} = handles.output;
function edit1_Callback(hObject, eventdata, handles)
% hObject handle to edit1 (see GCBO)
% eventdata reserved - to be defined in a future version of MATLAB
% handles structure with handles and user data (see GUIDATA)
% Hints: get(hObject,'String') returns contents of edit1 as text
% str2double(get(hObject,'String')) returns contents of edit1 as a double
% --- Executes during object creation, after setting all properties.
function edit1_CreateFcn(hObject, eventdata, handles)
% hObject handle to edit1 (see GCBO)
% eventdata reserved - to be defined in a future version of MATLAB
% handles empty - handles not created until after all CreateFcns called
% Hint: edit controls usually have a white background on Windows.
% See ISPC and COMPUTER.
if ispc && isequal(get(hObject,'BackgroundColor'), get(0,'defaultUicontrolBackgroundColor'))
set(hObject,'BackgroundColor','white');
end
% --- Executes on button press in pushbutton1.
function pushbutton1_Callback(hObject, eventdata, handles)
%definimos variables
t=str2num(get(handles.edit1,'string'));
k1=0.1;
%creacion de vectores
tmp=linspace(0,1,t)
At=Ao*exp(-k1*tmp)
%dialogo de decision
m=questdlg('Desea comenzar','mensaje','SI','NO','SI')
if strcmp (m,'SI')
for i=1:length(tmp)
G=plot(tmp(1:i),At(1:i),'Linewidth',2)
pause(0.01)
hold on
grid on
tittle('Rx quimica 1er orden')
xlabel('tiempo')
ylabel('conncentracion')
end
else
return
end
>>DE antemano muchas gracias :)
Valora esta pregunta


0
