GRAFICOS EN 3D
Publicado por Sebastian (1 intervención) el 18/01/2017 15:37:26
buenas no puedo hacer que me grafique las funciones, el codigo:
me dice : Error in ezimplot3 (line 62)
if is handle(varargin{1}) y otros errores.. alguien me puede ayudar a correrlo o indicarme el error
me dice : Error in ezimplot3 (line 62)
if is handle(varargin{1}) y otros errores.. alguien me puede ayudar a correrlo o indicarme el error
1
2
3
4
5
6
7
8
9
10
11
12
13
14
15
16
17
18
19
20
21
22
23
24
25
26
27
28
29
30
31
32
33
34
35
36
37
38
39
40
41
42
43
44
45
46
47
48
49
50
51
52
53
54
55
56
57
58
59
60
61
62
63
64
65
66
67
68
69
70
71
72
73
74
75
76
77
78
79
80
81
82
83
84
85
86
87
88
89
90
91
92
93
94
95
96
97
98
99
100
101
102
103
104
105
106
107
108
109
110
111
112
113
114
115
116
117
118
119
120
121
122
123
124
125
126
127
128
129
130
131
132
133
134
135
136
137
138
139
140
141
142
143
144
145
146
147
148
149
150
151
152
153
154
155
156
157
158
159
160
161
162
163
164
165
166
167
168
169
170
171
172
173
174
175
176
177
178
179
180
181
182
183
184
185
186
187
188
189
190
191
192
193
194
195
function h = ezimplot3(varargin)
% EZIMPLOT3 Easy to use 3D implicit plotter.
% EZIMPLOT3(FUN) plots the function FUN(X,Y,Z) = 0 (vectorized or not)
% over the default domain:
% -2*PI < X < 2*PI, -2*PI < Y < 2*PI, -2*PI < Z < 2*PI.
% FUN can be a string, an anonymous function handle, a .M-file handle, an
% inline function or a symbolic function (see examples below)
%
% EZIMPLOT3(FUN,DOMAIN)plots FUN over the specified DOMAIN instead of the
% default domain. DOMAIN can be vector [XMIN,XMAX,YMIN,YMAX,ZMIN,ZMAX] or
% vector [A,B] (to plot over A < X < B, A < Y < B, A < Z < B).
%
% EZIMPLOT3(..,N) plots FUN using an N-by-N grid. The default value for
% N is 60.
% EZIMPLOT3(..,'color') plots FUN with color 'color'. The default value
% for 'color' is 'red'. 'color' must be a valid Matlab color identifier.
%
% EZIMPLOT3(axes_handle,..) plots into the axes with handle axes_handle
% instead of into current axes (gca).
%
% H = EZIMPLOT3(...) returns the handle to the patch object this function
% creates.
%
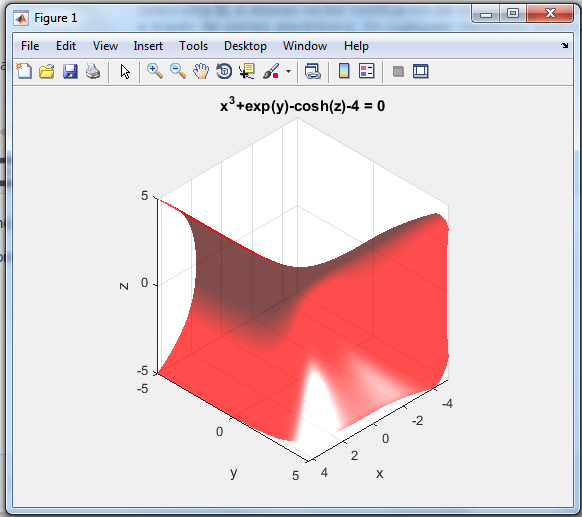
% Example:
% Plot x^3+exp(y)-cosh(z)=4, between -5 and 5 for x,y and z
%
% via a string:
% f = 'x^3+exp(y)-cosh(z)-4'
% ezimplot3(f,[-5 5])
%
% via a anonymous function handle:
% f = @(x,y,z) x^3+exp(y)-cosh(z)-4
% ezimplot3(f,[-5 5])
%
% via a function .m file:
%------------------------------%
% function out = myfun(x,y,z)
% out = x^3+exp(y)-cosh(z)-4;
%------------------------------%
% ezimplot3(@myfun,[-5 5]) or ezimplot('myfun',[-5 5])
%
% via a inline function:
% f = inline('x^3+exp(y)-cosh(z)-4')
% ezimplot3(f,[-5 5])
%
% via a symbolic expression:
% syms x y z
% f = x^3+exp(y)-cosh(z)-4
% ezimplot3(f,[-5 5])
%
% Note: this function do not use the "ezgraph3" standard, like ezsurf,
% ezmesh, etc, does. Because of this, ezimplot3 only tries to imitate that
% interface. A future work must be to modify "ezgraph3" to include a
% routine for implicit surfaces based on this file
%
% Inspired by works of: Artur Jutan UWO 02-02-98 ajutan@julian.uwo.ca
% Made by: Gustavo Morales UC 04-12-09 gmorales@uc.edu.ve
%
%%% Checking & Parsing input arguments:
if ishandle(varargin{1})
cax = varargin{1}; % User selected axes handle for graphics
axes(cax);
args{:} = varargin{2:end}; %ensuring args be a cell array
else
args = varargin;end
[fun domain n color] = argcheck(args{:});
%%% Generating the volumetric domain data:
xm = linspace(domain(1),domain(2),n);
ym = linspace(domain(3),domain(4),n);
zm = linspace(domain(5),domain(6),n);
[x,y,z] = meshgrid(xm,ym,zm);
%%% Formatting "fun"
[f_handle f_text] = fix_fun(fun); % f_handle is the anonymous f-handle for "fun"
% f_text is "fun" ready to be a title
%%% Evaluating "f_handle" in domain:
try
fvalues = f_handle(x,y,z); % fvalues: volume data
catch ME
error('Ezimplot3:Functions', 'FUN must have no more than 3 arguments');
end
%%% Making the 3D graph of the 0-level surface of the 4D function "fun":
h = patch(isosurface(x,y,z,fvalues,0)); % "patch" handles the structure...
% sent by "isosurface"
isonormals(x,y,z,fvalues,h)% Recalculating the isosurface normals based...
% on the volume data
set(h,'FaceColor',color,'EdgeColor','none');
%%% Aditional graphic details:
xlabel('x');ylabel('y');zlabel('z');% naming the axis
alpha(0.7) % adjusting for some transparency
grid on; view([1,1,1]); axis equal; camlight; lighting gouraud
%%% Showing title:
title([f_text,' = 0']);
%
%--------------------------------------------Sub-functions HERE---
function [f dom n color] = argcheck(varargin)
%ARGCHECK(arg) parses "args" to the variables "f"(function),"dom"(domain)
%,"n"(grid size) and "c"(color)and TRIES to check its validity
switch nargin
case 0
error('Ezimplot3:Arguments',...
'At least "fun" argument must be given');
case 1
f = varargin{1};
dom = [-2*pi, 2*pi]; % default domain: -2*pi < xi < 2*pi
n = 60; % default grid size
color = 'red'; % default graph color
case 2
f = varargin{1};
if isa(varargin{2},'double') && length(varargin{2})>1
dom = varargin{2};
n = 60;color = 'red';
elseif isa(varargin{2},'double') && length(varargin{2})==1
n = varargin{2};
dom = [-2*pi, 2*pi];
color = 'red';
elseif isa(varargin{2},'char')
dom = [-2*pi, 2*pi];
n = 60;color = varargin{2};
end
case 3 % If more than 2 arguments are given, it's
f = varargin{1}; % assumed they are in the correct order
dom = varargin{2};
n = varargin{3};
color = 'red'; % default color
case 4 % If more than 2 arguments are given, it's
f = varargin{1}; % assumed they are in the correct order
dom = varargin{2};
n = varargin{3};
color = varargin{4};
otherwise
warning('Ezimplot3:Arguments', ...
'Attempt will be made only with the 4 first arguments');
f = varargin{1};
dom = varargin{2};
n = varargin{3};
color = varargin{4};
end
if length(dom) == 2
dom = repmat(dom,1,3); %domain repeated in all variables
elseif length(dom) ~= 6
error('Ezimplot3:Arguments',...
'Input argument "domain" must be a row vector of size 2 or size 6');
end
%
%--------------------------------------------
function [f_hand f_text] = fix_fun(fun)
% FIX_FUN(fun) Converts "fun" into an anonymous function of 3 variables (x,y,z)
% with handle "f_hand" and a string "f_text" to use it as title
types = {'char','sym','function_handle','inline'}; % cell array of 'types'
type = ''; %Identifing FUN object class
for i=1:size(types,2)
if isa(fun,types{i})
type = types{i};
break;
end
end
switch type
case 'char' % Formatting FUN if it is char type. There's 2 possibilities:
% A string with the name of the .m file
if exist([fun,'.m'],'file')
syms x y z;
if nargin(str2func(fun)) == 3
f_sym = eval([fun,'(x,y,z)']); % evaluating FUN at the sym point (x,y,z)
else
error('Ezimplot3:Arguments',...
'%s must be a function of 3 arguments or unknown function',fun);
end
f_text = strrep(char(f_sym),' ',''); % converting to char and eliminating spaces
f_hand = eval(['@(x,y,z)',vectorize(f_text),';']); % converting string to anonymous f_handle
else
% A string with the function's expression
f_hand = eval(['@(x,y,z)',vectorize(fun),';']); % converting string to anonymous f_handle
f_text = strrep(fun,'.',''); f_text = strrep(f_text,' ',''); % removing vectorization & spaces
end
case 'sym' % Formatting FUN if it is a symbolic object
f_hand = eval(['@(x,y,z)',vectorize(fun),';']); % converting string to anonymous f_handle
f_text = strrep(char(fun),' ',''); % removing spaces
case {'function_handle', 'inline'} % Formatting FUN if it is a function_handle or an inline object
syms x y z;
if nargin(fun) == 3 && numel(symvar(char(fun))) == 3 % Determining if # variables == 3
f_sym = fun(x,y,z); % evaluating FUN at the sym point (x,y,z)
else
error('Ezimplot3:Arguments',...
'%s must be function of 3 arguments or unknown function',char(fun));
end
f_text = strrep(char(f_sym),' ',''); % converting into string to removing spaces
f_hand = eval(['@(x,y,z)',vectorize(f_text),';']); % converting string to anonymous f_handle
otherwise
error('First argument "fun" must be of type character, simbolic, function handle or inline');
end
Valora esta pregunta

0