Como graficar 2 funciones en GUIDE matlab (Desplazamiento de funciones)
Publicado por BANEY (1 intervención) el 02/04/2018 02:56:03
La función es la siguiente: 2tu(t)-2(t-1)u(t-1)-(t-2)u(t-2)+(t-4)u(t-4)-u(t-5)+u(t-6)
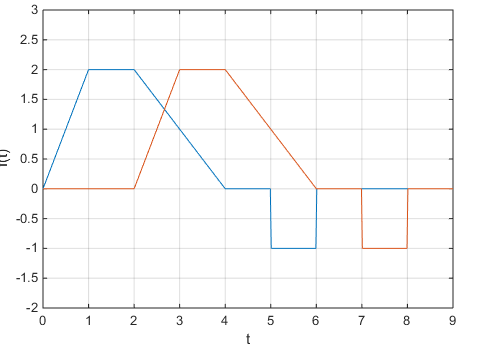
Un ejemplo de como debería graficar:

Sin embargo al realizarlo obtengo esto:

Código:
AUIDAAAA!
Un ejemplo de como debería graficar:

Sin embargo al realizarlo obtengo esto:

Código:
1
2
3
4
5
6
7
8
9
10
11
12
13
14
15
16
17
18
19
20
21
22
23
24
25
26
27
28
29
30
31
32
33
34
35
36
37
38
39
40
41
42
43
44
45
46
47
48
49
50
51
52
53
54
55
56
57
58
59
60
61
62
63
64
65
66
67
68
69
70
71
72
73
74
75
76
77
78
79
80
81
82
83
84
85
86
87
88
89
function pbg_Callback(hObject, eventdata, handles)
% 2tu(t)-2(t-1)u(t-1)-(t-2)u(t-2)+(t-4)u(t-4)-u(t-5)+u(t-6)
s = get(handles.editf,'String');
i = get(handles.edit_i,'String');
f = get(handles.edit_f,'String');
id = get(handles.editd,'String');
i_i = str2double(i);
i_f = str2double(f);
i_d = str2double(id);
sc = convert(s);
syms t;
intervalo = i_i:0.001:i_f;
s1 = eval(sc)
f1 = symfun(s1,[t]);
fo = f1(intervalo);
plot(handles.axes1,intervalo,fo,'b');
grid on;
%Desplazamiento.
if i_d > 0signo = '+';
else
signo = '';
end
desp = strrep(sc, 't', ['t' num2str(i_d)])
s2 = eval(desp)
f1 = symfun(s2,[t]);
fo = f1(intervalo);
hold on;
plot(handles.axes1,intervalo,fo,'r');
grid on;
FUNCIÓN convert():
function c= convert(string)
s1 = string;%Cambio de 't' a 't*'.
s1 = strrep(s1,'tu(','t*heaviside(');
s2 = s1;s2 = strrep(s1,'t*','*t*');
s1 = s2;%Cambio de 'u' a 'heaviside'.
s2 = strrep(s2,')u',')*heaviside');
s3 = s2;s3 = strrep(s3,'+u','+heaviside');
s2 = s3;s3 = strrep(s3,'-u','-heaviside');
s2 = s3; %s2 = strrep(s2,'*u','*heaviside');
s2 = s3;%Cambio de '#(' a '#*('.
for i=1:1:10
n2s = num2str(i-1); %Convierto el número a comparar en un string.
cato = strcat(n2s,'('); %Concateno el string y el simbolo.
catc = strcat(n2s,'*(');
s2 = strrep(s2,cato,catc);
end
c = s2;end
AUIDAAAA!
Valora esta pregunta


0