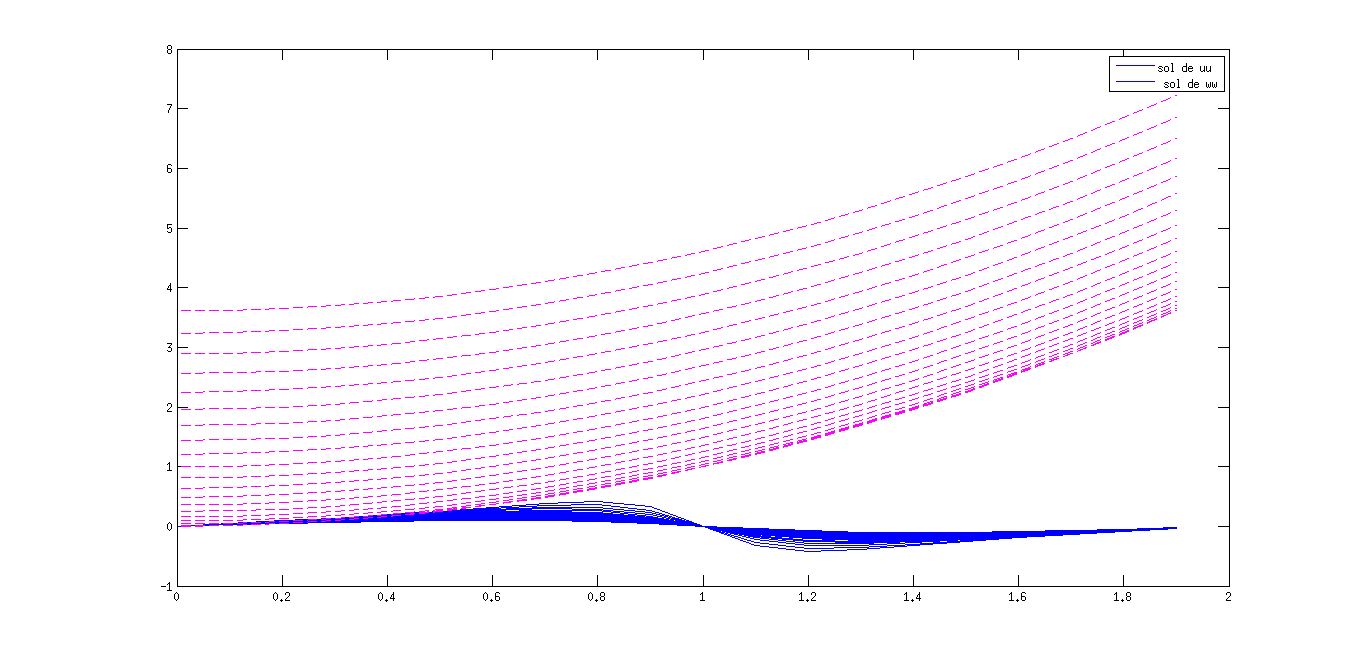
error con leyenda de 2 graficos
Publicado por wil (26 intervenciones) el 22/06/2020 03:40:09
Hola, estaba colocando la leyenda a los graficos, pero veo que me sale el mismo color azul (como lo puedo arreglar?). Lo que quiero es que la leyenda del primero salga azul (linea continua ) y el otro rosa en trazos.

1
2
3
4
5
6
7
8
9
10
11
12
13
14
15
16
17
18
19
20
21
22
23
24
25
26
27
28
29
30
31
32
33
34
35
36
37
38
39
40
41
42
43
44
45
46
% numerical and analytical solutionsM=20;N=20;
h=0.1;k=0.1;
m=M+1; n=N;
D=0.05; alf=5; bet=4;
x=(0:m-1)*h;
t=(0:N)*k;
w=zeros(M,N);
w=@(x,t) x^2+t^2;
%u=@(x,t) (2*D*bet*pi*sin(pi*x)*exp(-D*pi*pi*t))./(alf+bet*cos(pi*x)*exp(-D*pi*pi*t)) ;for it=1:m-1
%fprintf('\n t x u(anal) err\n');for i=1:n
uu(it,i)=(2*D*bet*pi*sin(pi*x(it))*exp(-D*pi*pi*t(i)))./(alf+bet*cos(pi*x(it))*exp(-D*pi*pi*t(i)));
end
end
for it=1:m-1
%fprintf('\n t x u(anal) err\n');for i=1:n
ww(it,i)=x(it)^2+t(i)^2;
end
end
for it=1:m-1
fprintf('\n x \t t \t \t u \n');
for i=1:n
%fprintf('%6.2f %6.1f %15.6f \n',x(it),t(i),uu(it,i));fprintf('%7.3f %7.3f %15.6f \n',x(it),t(i),uu(it,i)); % cambie el formato de impresion para M=20 y N=40
end
end
figure ,plot(x(1:m-1),uu(1:m-1,1:n),'r')
hold on
plot(x(1:m-1),ww(1:m-1,1:n),'b-')
legend('sol de uu',' sol de ww')

Valora esta pregunta


0

