
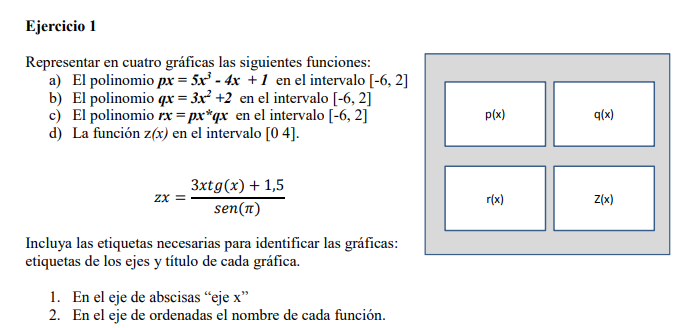
Representar en cuatro gráficas las siguientes funciones:
Publicado por bernardo (15 intervenciones) el 21/01/2021 21:44:06
Valora esta pregunta

-2
Crear cuenta
%% Funcionesx1 = -6 : 0.1 : 2;
px = 5.*x1.^3 - 4.*x1 + 1;
qx = 3.*x1.^2 + 2;
rx = px .* qx;
x2 = 0 : 0.1 : 4;
zx = (3.*x2 .* tan(x2) + 1.5) / sin(pi);
%% Gráficasfigure;
subplot(2,2,1);
plot(x1,px);
grid on;
xlabel('eje x');
ylabel('p(x)');
subplot(2,2,2);
plot(x1,qx);
grid on;
xlabel('eje x');
ylabel('q(x)');
subplot(2,2,3);
plot(x1,rx);
grid on;
xlabel('eje x');
ylabel('r(x)');
subplot(2,2,4);
plot(x2,zx);
grid on;
xlabel('eje x');
ylabel('z(x)');
