
Ayuda para realizar el gráfico de una función
Publicado por Yonattan (11 intervenciones) el 21/12/2019 18:04:12
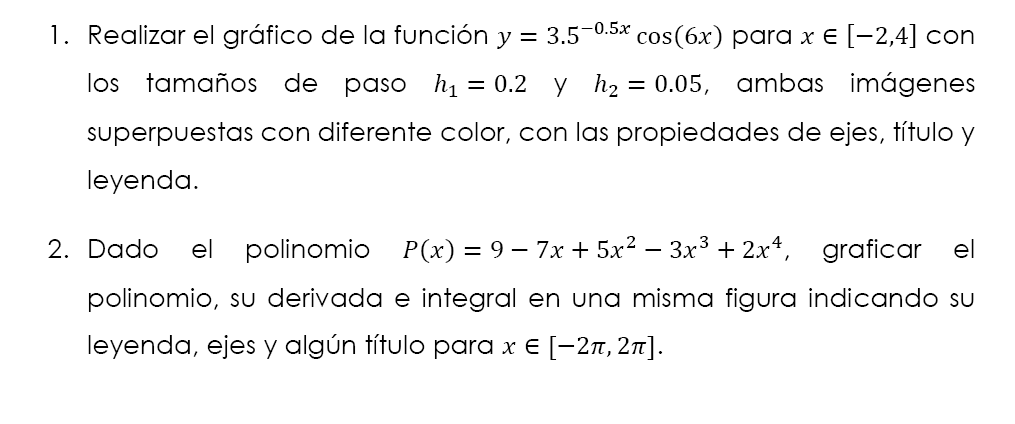
NECESITO AYUDA EN HACER ESO.REALMENTE NO ME SALE.,. GRACIAS.
Valora esta pregunta

0
Crear cuenta
clear
syms x
y=3.5^(-0.5*x)*cos(x);
h1=0.2; h2=0.05;
X1=-2:h1:4; X2=-2:h2:4;
FX1=subs(y,x,X1);
FX2=subs(y,x,X2);
plot(X1,FX1,'r', X2,FX2,'b')
xlabel('X1 , X2')
ylabel('FX1 , FX2')
legend('FX1','FX2')
title (char(y))
clear
syms x
p=9-7*x+5*x^2-3*x^3+2*x^4;
dp=diff(p);
ip=int(p);
X=-2*pi:0.1:2*pi;
P=subs(p,x,X);
DP=subs(dp,x,X);
IP=subs(ip,x,X);
plot(X,P,'r', X,DP,'b', X,IP,'m')
xlabel('X')
ylabel('P , DP, IP')
legend('Polinomio','Su derivada', 'su integral')
title (['p(x)=',char(p)])
grid on
