
GRAFICAS MATLAB imagesc +plot
Publicado por jorge (2 intervenciones) el 28/12/2019 01:59:42
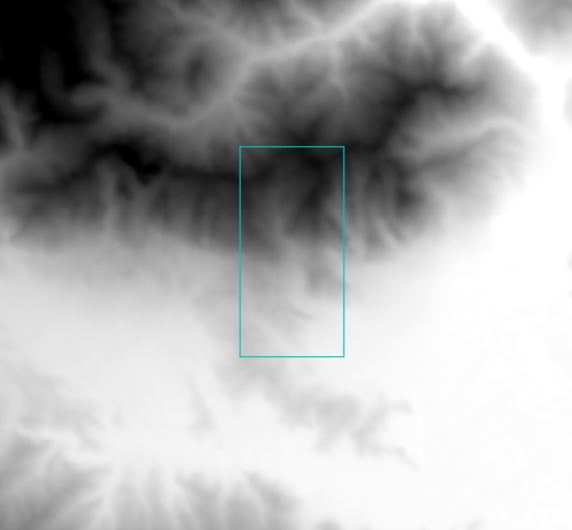
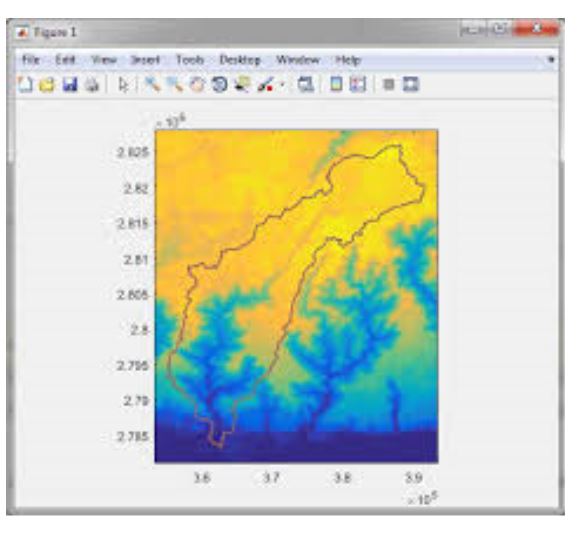
Deseo obtener un gráfico en matlab juntando las funciones imagesc y plot como se ve en las imágenes,adjunto los datos :D.
1
2
3
4
5
6
7
8
9
10
11
12
13
14
15
16
17
18
19
20
21
22
23
24
%% INGRESO DE DATOSclear,clc,close all
TEM=('TEM_IDW_300719.tif');
%%[tem,R]=geotiffread(TEM);
tem=double(tem);
infoR=geotiffinfo(TEM);
%% obtener las coordenadasx=linspace(R.XWorldLimits(1),R.XWorldLimits(2),R.RasterSize(2));
y=linspace(R.YWorldLimits(2),R.YWorldLimits(1),R.RasterSize(1));
%%roi = shaperead('Ramuschaka.shp');
%%imagesc(x,y,tem),colorbar,colormap(jet)
axis xy
hold on
plot(roi.X,roi.Y)
grid on
title({'Interpolacion';'Kriging Ordinario'});
xlabel('ESTE','fontsize',8)
ylabel('NORTE','fontsize',8)
set(gca,'ZTickLabel',{}, 'FontSize',10);
c=colorbarc.Label.String = 'Temperatura (C°)';
- datos.rar(579,0 KB)
Valora esta pregunta

0
