Matlab - Acotar dibujos en Matlab

 
Vista:
sin imagen de perfil

Acotar dibujos en Matlab

Publicado por K (4 intervenciones) el 23/12/2016 17:18:12
Cuna

Hola,
Estoy tratando de graficar en Matlab la figura que se muestra en la imagen. Pero no sé como poner las cotas (flechas y textos en colores). Como lo puedo hacer?
Muchas gracias
Valora esta pregunta
Me gusta: Está pregunta es útil y esta claraNo me gusta: Está pregunta no esta clara o no es útil
0
Responder
Imágen de perfil de Royeth
Val: 3.309
Plata
Ha mantenido su posición en Matlab (en relación al último mes)
Gráfica de Matlab

Acotar dibujos en Matlab

Publicado por Royeth (1818 intervenciones) el 24/12/2016 02:46:50
para esto se usa lo que es la annotation , te dejo un ejemplo que al final te muestra todas las propiedades que puedes editar y manejar a tu gusto

1
2
3
4
5
6
figure
plot(1:10)
x = [0.3 0.5];
y = [0.6 0.5];
b=annotation('doublearrow',x,y,'color','r');
get(b)

aquí hay otros ejemplos

https://www.mathworks.com/help/matlab/ref/annotation.html


espero te sea de ayuda
saludos
https://www.facebook.com/royethmatlab/
Valora esta respuesta
Me gusta: Está respuesta es útil y esta claraNo me gusta: Está respuesta no esta clara o no es útil
1
Comentar
Imágen de perfil de JOSE JEREMIAS CABALLERO
Val: 6.975
Oro
Ha mantenido su posición en Matlab (en relación al último mes)
Gráfica de Matlab

Acotar dibujos en Matlab

Publicado por JOSE JEREMIAS CABALLERO (5917 intervenciones) el 24/12/2016 04:39:39
1
2
3
4
5
6
7
8
9
10
11
12
13
14
15
16
17
18
19
20
21
22
23
24
25
26
27
28
29
30
31
32
33
34
35
36
37
38
39
40
41
42
43
clear all
close all
x(1)=5;     y(1)=6;
x(2)=15;   y(2)=6;
x(3)=15;     y(3)=18;
x(4)=5;       y(4)=18;
figure1=figure;
n=0.3;
% cuadrano negro
x=[5  15    15   5    5];
y=[6    6     18   18  6];
plot(x,y,'linewidth',2,'color',[0 0 0]); hold on
plot(x,y,  'o','markersize',10, 'color',[0 0 1],   'linewidth',2, 'MarkerFaceColor',[0 0 0]  )
plot([x(1) x(2)],[ (y(3)+y(1))/2  (y(3)+y(1))/2 ],'--k')
plot([(x(2)+x(1))/2  (x(2)+x(1))/2 ],[y(1) y(3)],'--k')
 
%rombo rojo
x1=[x(1)+n  (x(2)+x(1))/2  x(2)-n   (x(2)+x(1))/2   x(1)+n ];
y1=[(y(3)+y(1))/2  y(2)+n   (y(3)+y(1))/2  y(3)-n   (y(3)+y(1))/2  ];
plot(x1,y1,'linewidth',2,'color',[1 0 0])
plot(x1,y1, 'o','markersize',10,  'color',[0 0 1],    'linewidth',2,   'MarkerFaceColor',[1 0 0]  )
xx1=[x(1) (x1(1)+x1(2))/2  ];
yy1=[y(1)  (y1(1)+y1(2))/2  ];
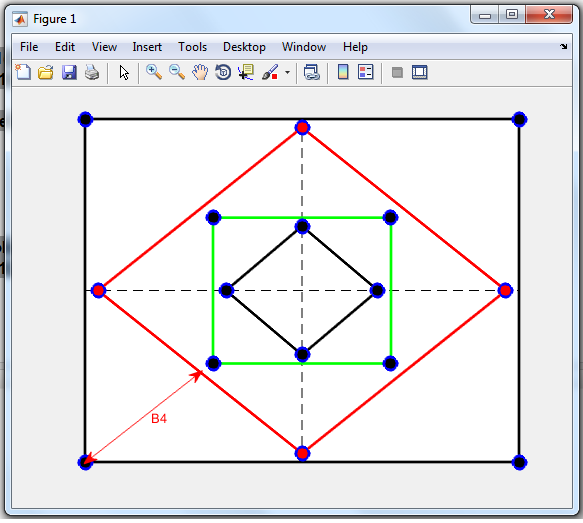
annotation(figure1,'doublearrow',[xx1(1)/39 xx1(2)/22.5], [yy1(1)/57  yy1(2)/28],'color', [1 0 0]);
text(sum(xx1)/2+0.2, sum(yy1)/2,'B4',  'color',[1 0 0]  )
grid on
 
%cuadrado  verde
x2=[ (x1(1)+x1(2))/2+n   (x1(2)+x1(3))/2-n         (x1(2)+x1(3))/2-n       (x1(1)+x1(2))/2+n    (x1(1)+x1(2))/2+n   ];
y2=[ (y1(1)+y1(2))/2+n     (y1(1)+y1(2))/2+n       (y1(3)+y1(4))/2-n       (y1(3)+y1(4))/2-n    (y1(1)+y1(2))/2+n   ];
plot(x2,y2,'linewidth',2,'color',[0 1 0])
plot(x2,y2,  'o','markersize',10,    'color',[0 0 1],   'linewidth',2,   'MarkerFaceColor',[0 0 0]  )
 
%rombo negro
x3=[x2(1)+n  (x2(2)+x2(1))/2  x2(2)-n   (x2(2)+x2(1))/2   x2(1)+n ];
y3=[(y2(3)+y2(1))/2  y2(2)+n   (y2(3)+y2(1))/2  y2(3)-n   (y2(3)+y2(1))/2  ];
plot(x3,y3,'linewidth',2,'color',[0 0 0])
plot(x3,y3, 'o','markersize',10, 'color',[0 0 1],  'linewidth',2, 'MarkerFaceColor',[0 0 0]  )
% annotation(figure1,'doublearrow',[xx1(2)/39  (x3(1)+x3(2))/(2*22.5)], [yy1(2)/28  yy1(2)/28],'color', [1 0 0]);
 
hold off
 set(gca,'xtick',[])
 set(gca,'ytick',[])


Saludos.
JOSE JEREMIAS CABALLERO
Asesor de Proyectos con Matlab
programador en matlab
Servicios de programación matlab
[email protected]


http://matlabcaballero.blogspot.com
flechas1
Valora esta respuesta
Me gusta: Está respuesta es útil y esta claraNo me gusta: Está respuesta no esta clara o no es útil
1
Comentar