Graficar funciones en un mismo axis
Publicado por Eliezer (1 intervención) el 18/06/2019 02:26:23
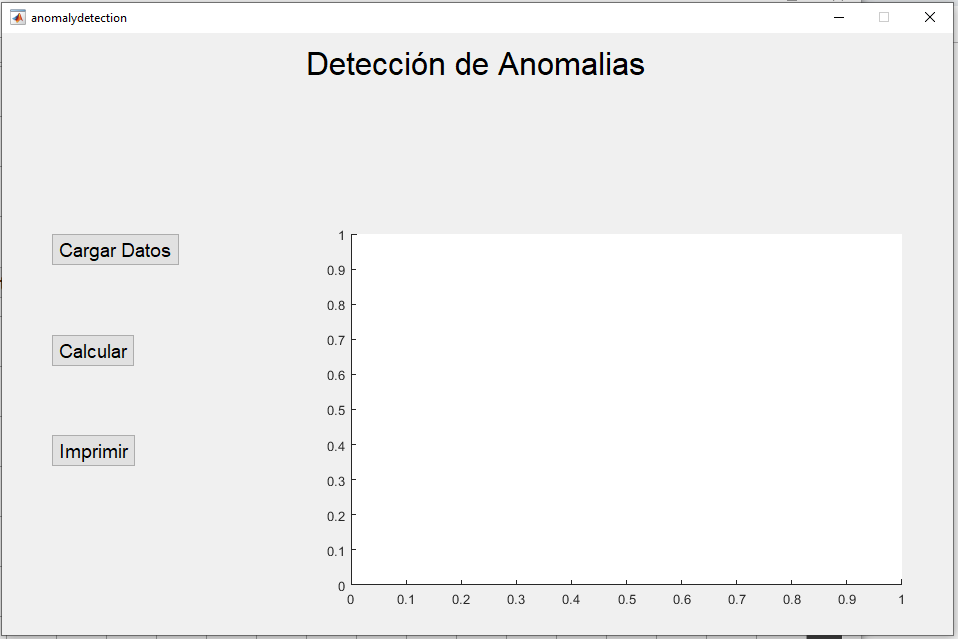
Mi proyecto consiste en agregar interfaz grafica al siguiente repositorio https://github.com/trekhleb/machine-learning-octave Estoy con el primer algoritmo es deteccion de anomalias con machine learning y tengo la siguiente interfaz

Con el boton cargar, abro un archivo . mat donde estan todos los datos para el algoritmo, con el boton calcular hace todo el procedimiento, ahora bien el problema que tengo es el siguiente necesito graficar en la gui que presento arriba pero por mas codigo que le ponga siempre abre una nueva ventana y ahi grafica todo he intendado con
que es una solucion aceptada en varios temas de este foro pero nada dejo el fragmento del codigo del boton calcular
Y adjunto el .fig y m de mi proyecto
Espero me puedan ayudar
muchas gracias
Con el boton cargar, abro un archivo . mat donde estan todos los datos para el algoritmo, con el boton calcular hace todo el procedimiento, ahora bien el problema que tengo es el siguiente necesito graficar en la gui que presento arriba pero por mas codigo que le ponga siempre abre una nueva ventana y ahi grafica todo he intendado con
1
axes(handles.axes1);
que es una solucion aceptada en varios temas de este foro pero nada dejo el fragmento del codigo del boton calcular
1
2
3
4
5
6
7
8
9
10
11
12
13
14
15
16
17
18
19
20
21
22
23
24
25
26
27
28
29
30
31
32
33
34
35
36
37
38
39
40
41
42
43
44
45
46
47
48
49
50
51
52
53
54
function btnCalcular_Callback(hObject, eventdata, handles)
% Load the data.
clear; close all; clc;
fprintf('Loading data...\n');
global nombre;
global carpeta;
load(strcat(carpeta,nombre),'X','Xval','yval');
% Estimate mu and sigma2.
fprintf('Estimating mu and sigma2...\n');
[mu sigma2] = estimate_gaussian(X);
% Visualize the fit.
fprintf('Visualizing data and Gaussian distribution...\n');
[X1, X2] = meshgrid(0:.5:35);
Z = multivariate_gaussian([X1(:) X2(:)], mu, sigma2);
Z = reshape(Z, size(X1));
% Visualize training data set.
hold on;
axes(handles.axis);
plot(X(:, 1), X(:, 2),'bx');
% Do not plot if there are infinities
if (sum(isinf(Z)) == 0)
contour(X1, X2, Z, 10 .^ (-20:3:0)');
end
xlabel('Latency (ms)');
ylabel('Throughput (mb/s)');
title('Servers Parameters');
% Returns the density of the multivariate normal at each data point (row) of X.
probabilities = multivariate_gaussian(X, mu, sigma2);
% Select best threshold.
fprintf('Selecting a best threshold...\n');
[epsilon F1] = select_threshold(yval, probabilities);
fprintf('Best epsilon found using cross-validation: %e\n', epsilon);
fprintf('Best F1 on Cross Validation Set: %f\n', F1);
% Plottin outliers.
fprintf('Plottin outliers...\n');
% Find the outliers in the training set and plot them.
outliers = find(probabilities < epsilon);
% Draw a red circle around those outliers
hold on;
plot(X(outliers, 1), X(outliers, 2), 'ro', 'LineWidth', 2, 'MarkerSize', 10);
legend('Training set', 'Gaussian contour', 'Anomalies');
Y adjunto el .fig y m de mi proyecto
Espero me puedan ayudar
muchas gracias
- anomaly-detection.7z(24,7 KB)
Valora esta pregunta


0
