
Problem with PCA 3d plot
Publicado por Juan Diego (1 intervención) el 05/01/2023 22:59:13
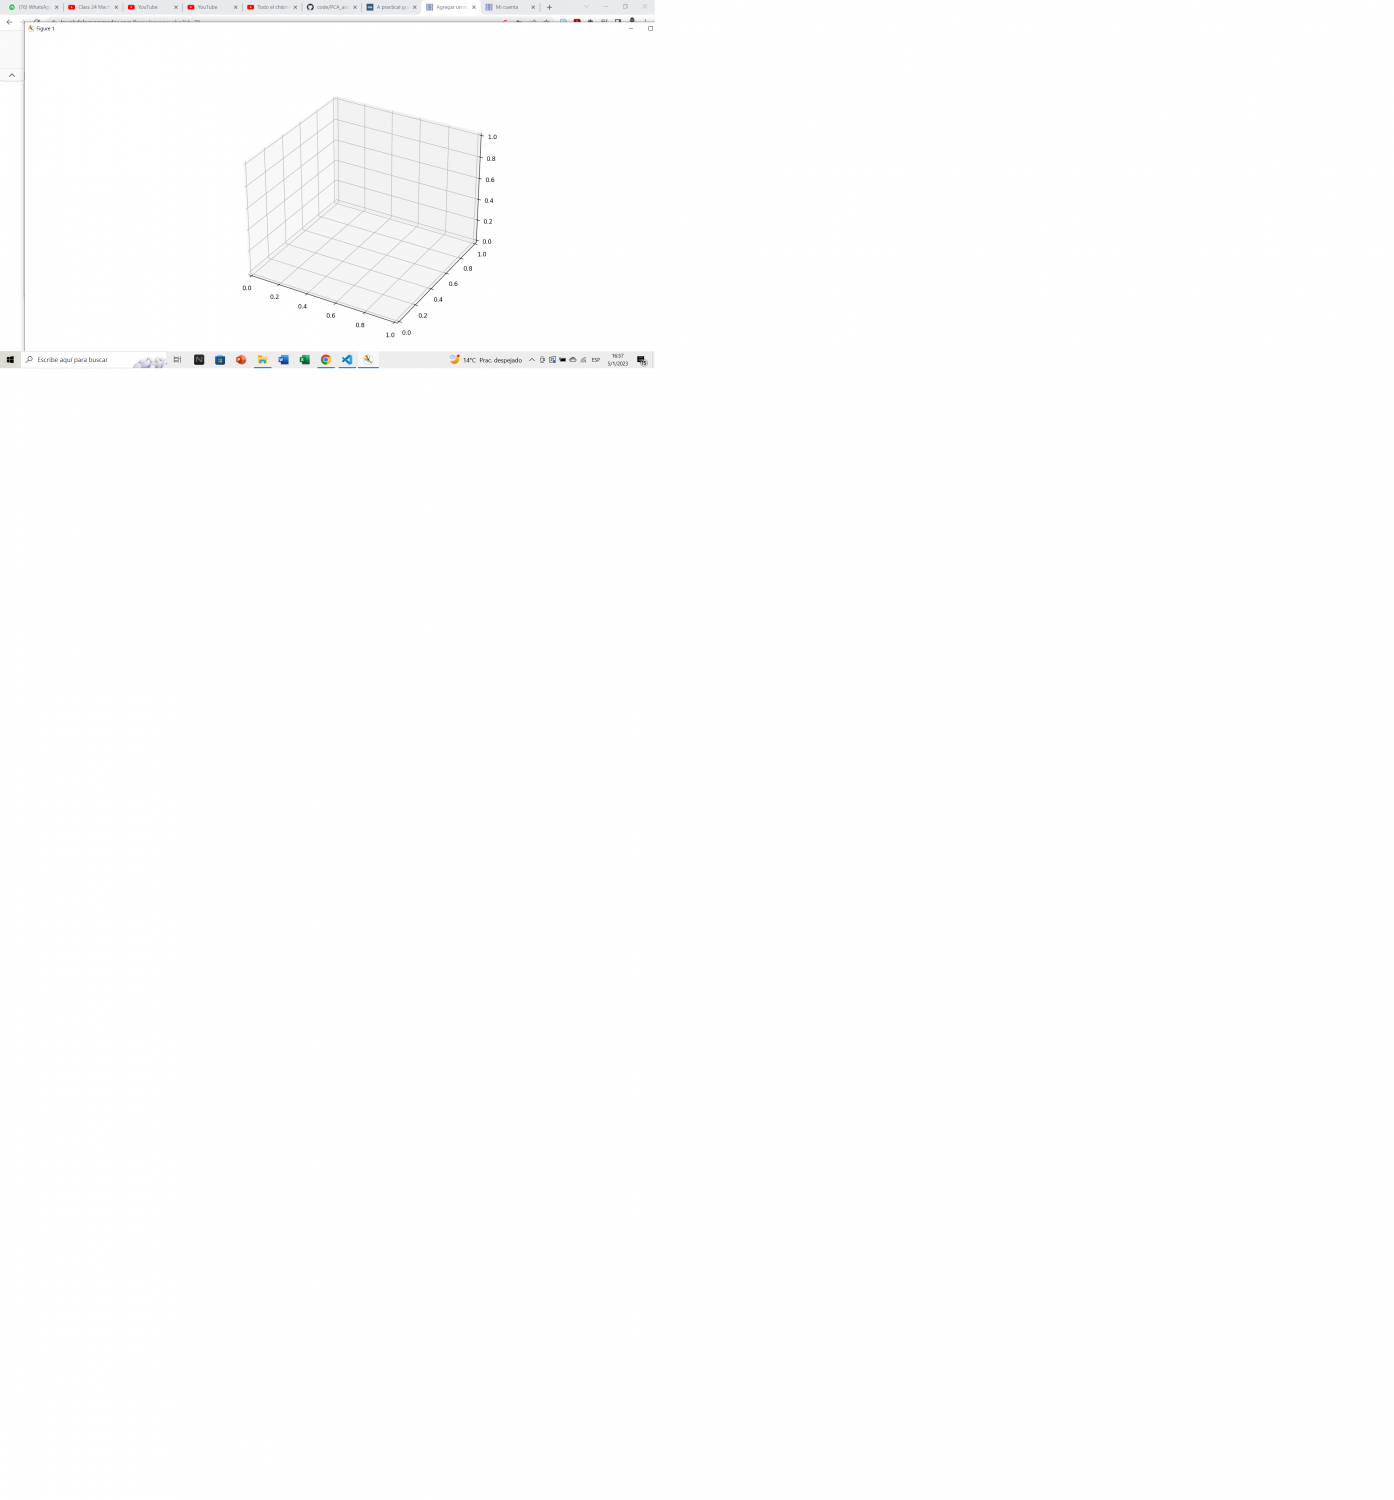
I have this code with pip install pca, and the biplot 2d is great, but when i try to turn it into 3d plot is empty, and i already read the guide but i don't know what to do
import numpy as np
import matplotlib.pyplot as plt
import pandas as pd
import seaborn as sns
import warnings
warnings.filterwarnings('ignore')
from pca import pca
df = pd.read_excel('Empezando/1.1 Matrices.xlsx', sheet_name= 'PCA' )
df.head()
df.info()
df.columns #sin()
df.shape
df['Meso'].value_counts() #tuve que cambiar el formato de meso a texto, sino no da
df
x = df.drop('Meso',axis=1) #scaling the feature will be automaticlly done
x
Labels = df.Meso
Labels
df.groupby(['Meso']).mean().round(2) #arroja las medias, en mi caso no sirve por que hay solo de a un dato
df.info()
model = pca(n_components=3, normalize=True, alpha=0.05, detect_outliers=['ht2', 'spe'])
results = model.fit_transform(x)
x
#resultados
loadings= results['loadings'] #ojo con los corchetes
loadings
scores = results['PC'] #ojo con los corchetes
scores['Labels'] = Labels
scores.head()
results['explained_var']
model.plot(figsize=(10,8))
plt.show()
model.biplot(n_feat=24, legend = False, figsize = (16,12), y = Labels, label= True, PC=[0,1,2], color_arrow='r', cmap='Set1', visible=True, verbose=3, d3 = False)
#24 n feat
plt.show()
Valora esta pregunta

0