<!DOCTYPE html>
<html>
<head>
<meta charset="utf-8">
<style>
#myCanvas {
float:left;
}
legend { font-family:Arial;
font-size:12px;
float:left;
margin-top:50px;
}
#tip {
background-color:white;
border:1px solid #808080;
position:absolute;
left:-200px;
top:100px;
}
</style>
</head>
<body>
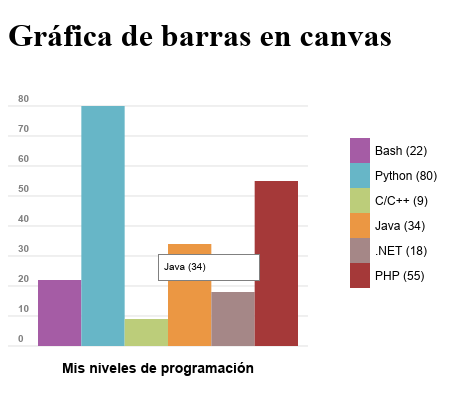
<h1>Gráfica de barras en canvas</h1>
<div>
<canvas id="myCanvas"></canvas>
<legend for="myCanvas"></legend>
<canvas id="tip" width=100 height=25></canvas>
</div>
</body>
</html>
<script>
/**
* Funcion para dibujar una linea
* @receive element ctx
* @receive integer startX
* @receive integer startY
* @receive integer endX
* @receive integer endY
* @receive string color in html format
*/
function drawLine(ctx, startX, startY, endX, endY,color) { ctx.save();
ctx.strokeStyle = color;
ctx.beginPath();
ctx.moveTo(startX,startY);
ctx.lineTo(endX,endY);
ctx.stroke();
ctx.restore();
}
/**
* Funcion para dibujar un rectangulo
* @receive element ctx
* @receive integer upperLeftCornerX
* @receive integer upperLeftCornerY
* @receive integer width
* @receive integer height
* @receive string color in html format
*/
function drawBar(ctx, upperLeftCornerX, upperLeftCornerY, width, height,color) { ctx.save();
ctx.fillStyle=color;
ctx.fillRect(upperLeftCornerX,upperLeftCornerY,width,height);
ctx.restore();
}
/**
* Clase para crear el gráfico de barras
* @receive array options
* canvas: objeto canvas
* tip: objeto canvas
* data: array de valores
* name: texto
* colors: array de colores para cada columna
*/
var BarChart = function(options) { this.name = options.name;
this.data = options.data
this.canvas = options.canvas;
this.ctx = this.canvas.getContext("2d"); this.tip = options.tip;
this.ctxTip = this.tip.getContext("2d"); this.colors = options.colors;
this.dots=[];
that=this;
this.draw = function(){ var padding=30;
var maxValue = Math.max(...Object.values(this.data));
var canvasActualHeight = this.canvas.height - padding * 2;
var canvasActualWidth = this.canvas.width - padding - 10;
var gridScale = Math.round(maxValue/8);
// dibujamos el grid
var gridValue = 0;
while (gridValue <= maxValue){ var gridY = canvasActualHeight * (1 - gridValue/maxValue) + padding;
drawLine(
this.ctx,
0,
gridY,
this.canvas.width,
gridY,
"#e1e1e1"
);
// dibujamos los numeros en el grid
this.ctx.save();
this.ctx.fillStyle = "#808080";
this.ctx.textBaseline="bottom";
this.ctx.font = "bold 10px Arial";
this.ctx.fillText(gridValue, 10,gridY - 2);
this.ctx.restore();
gridValue+=gridScale;
}
// dibujamos las barras
var barIndex = 0;
var numberOfBars = Object.keys(this.data).length;
var barSize = (canvasActualWidth)/numberOfBars;
for (categ in this.data){ let val = this.data[categ];
let barHeight = Math.round( canvasActualHeight * val/maxValue) ;
drawBar(
this.ctx,
padding + barIndex * barSize,
this.canvas.height - barHeight - padding,
barSize,
barHeight,
this.colors[barIndex%this.colors.length]
);
let x=padding + barIndex * barSize;
let y=this.canvas.height - barHeight - padding;
this.dots.push({x:x, y:y, w:(x+barSize), h:(y+barHeight)}); barIndex++;
}
// dibujamos el nombre
this.ctx.save();
this.ctx.textBaseline="bottom";
this.ctx.textAlign="center";
this.ctx.fillStyle = "#000000";
this.ctx.font = "bold 14px Arial";
this.ctx.fillText(this.name, this.canvas.width/2,this.canvas.height);
this.ctx.restore();
// dibujamos la leyenda
barIndex = 0;
var legend = document.querySelector("legend[for='myCanvas']"); var ul = document.createElement("ul"); legend.append(ul);
for (categ in this.data){ let li = document.createElement("li"); li.style.listStyle = "none";
li.style.borderLeft = "20px solid "+this.colors[barIndex%this.colors.length];
li.style.padding = "5px";
li.textContent = categ+" ("+this.data[categ]+")"; ul.append(li);
barIndex++;
}
}
/**
* Funcion para mostrar el tooltip
*/
this.handleMouseMove=function(e){ mouseX=parseInt(e.clientX-(e.clientX-e.offsetX));
mouseY=parseInt(e.clientY-(e.clientY-e.offsetY));
for (let i = 0; i < this.dots.length; i++) { let dot = this.dots[i];
if(mouseX>dot.x && mouseX<dot.w && mouseY>dot.y && mouseY<dot.h)
{ let rect=this.canvas.getBoundingClientRect();
this.tip.style.left = (dot.x + rect.left - 10) + "px";
this.tip.style.top = (dot.y + rect.top + 10) + "px";
this.ctxTip.clearRect(0, 0, this.tip.width, this.tip.height);
let text=Object.keys(this.data)[i];
this.ctxTip.fillText(text+" ("+this.data[text]+")", 5, 15); return;
}
}
this.tip.style.left = "-200px";
}
this.canvas.addEventListener("mousemove",function(e){that.handleMouseMove(e);});}
var myCanvas = document.getElementById("myCanvas");var myTip = document.getElementById("tip");myCanvas.width = 300;
myCanvas.height = 300;
var MisNiveles = { "Bash": 22,
"Python": 80,
"C/C++": 9,
"Java": 34,
".NET":18,
"PHP":55
};
var myBarChart = new BarChart(
{ canvas:myCanvas,
tip:myTip,
data:MisNiveles,
name:"Mis niveles de programación",
colors:["#a55ca5","#67b6c7","#bccd7a","#eb9743", "#a58787", "#a53939"]
}
);
myBarChart.draw();
</script>


Comentarios sobre la versión: Versión 1.0b (2)