<!DOCTYPE html>
<html>
<head>
<meta charset="utf-8">
<style>
#myCanvas, #myCanvas2 {
background-color:White;
}
legend { font-family:Arial;
font-size:12px;
float:left;
margin-top:50px;
}
legend ul {padding-left:20px;} legend li { list-style:none;
padding:5px;
margin-bottom: 1px;
}
#tip {
background-color:white;
border:1px solid #808080;
position:absolute;
left:-200px;
top:100px;
}
</style>
</head>
<body>
<div>
<div>
<canvas id="myCanvas"></canvas>
<legend id="myCanvasLegend"></legend>
</div>
<div>
<canvas id="myCanvas2"></canvas>
<legend id="myCanvasLegend2"></legend>
</div>
<canvas id="tip" width=100 height=25></canvas>
</div>
</body>
</html>
<script>
/**
* Clase para crear el gráfico de barras
* @param {json} data
* canvas: objeto canvas
* tip: objeto del tipo ToolTip()
* Si no se recibe, no muestra el tooltip
* legend: objeto del tipo Legend()
* Si no se recibe, no genera la leyenda
* title: texto.
* Si no se recibe no se muestra y aumenta el tamaño del grafico
* dataHorizontal: array con los valores para el eje horizontal.
* Los valores vacios no se muestran
* Si no se recibe no se muestra y aumenta el tamao del grafico
* ["Ene","","","Abr", ...]
* horizontalText: string con el texto a mostrar centrado en la barra horizontal X
* showHorizontalSmallLines: boolean define si mostramos las lineas pequeñas en la barra horizontal X
* adjustMin : [true|false] determina si el valor minimo de la grafica se ajusta al minimo recibido
* reverseY : [true|false] determina si los valores aumentas de arriba hacia abajo o al reves
* values: array de valores del tipo
* {
* "texto":{
* color:"...",
* colorUp:"...",
* colorDown:"...",
* valores:[valores],
* text:[valores], # tooltip
* drawBullet:true|false,
* showTip:true|false
* },
* "texto2":{
* color:"...",
* colorUp:"...",
* colorDown:"...",
* valores:[valores],
* text:[valores], # tooltip
* drawBullet:true|false,
* showTip:true|false
* },
* }
*/
function Chart(data) { this.canvas = data.canvas;
this.legend = data.legend;
this.tip = data.tip;
this.dataHorizontal = data.dataHorizontal;
this.horizontalText = data.horizontalText;
this.showHorizontalSmallLines=data.showHorizontalSmallLines;
this.title = data.title;
this.adjustMin=data.adjustMin;
this.data = data.values;
this.reverseY = data.reverseY;
this.datakeys = Object.keys(this.data);
this.ctx = this.canvas.getContext("2d");
};
Chart.prototype.draw = function() { var padding=20;
var that=this;
this.ctx.fillStyle = "#808080";
this.ctx.font = "bold 10px Arial";
// si hay titulo lo mostramos y incrementamos la altura superior del grafico
var paddingTop=paddingBottom=paddingLeft=0;
var paddingRight=10;
if(this.title) { this.drawTitle();
paddingTop=30;
}
// Si hay valores en el eje horizontal...
if(this.dataHorizontal) { paddingBottom=15;
}
if(this.horizontalText) { paddingBottom+=15;
}
var [maxValue,minValue,numberValues]=this.findGetMaxValue(this.data);
if(this.adjustMin===false) { minValue=0;
}
var difMaxMin=maxValue-minValue;
if(this.adjustMin) { if(difMaxMin%10!==0)
difMaxMin+=10-difMaxMin%10;
}
// obtenemos la anchura de maxValue con la fuente indicada en this.ctx.font
paddingLeft=this.ctx.measureText(maxValue).width;
var graphHeight = this.canvas.height - padding * 2 - paddingTop - paddingBottom;
var graphWidth = this.canvas.width - padding - 10 - paddingLeft - paddingRight;
var numberOfBars = numberValues-1;
var barSize = (graphWidth)/numberOfBars;
var barIndex = 0;
// dibujamos el eje Y y las barras horizontales
this.drawAxisY(
minValue,
maxValue,
difMaxMin,
graphHeight,
padding+paddingTop
);
// dibujamos el eje X con sus valores, lineas verticales o marcas verticales
this.drawAxisX(
padding+paddingTop,
graphHeight+padding+paddingTop,
padding+paddingLeft,
barSize
);
// dibujamos las lineas del grafico
this.drawChart(
minValue,
maxValue,
graphHeight,
padding,
paddingLeft,
paddingTop,
paddingBottom,
barSize
);
if(this.legend) { this.legend.draw(this.data);
}
};
/**
* Function que devuelve un array con el elemento mas grande, pequeño y
* cantidad de elementos de todos los valores recibidos para el grafico
*/
Chart.prototype.findGetMaxValue=function(data) { var max=0;
var numberValues=0;
var min=Number.MAX_SAFE_INTEGER;
var datakeys=Object.keys(data)
for(var key of datakeys) { if(max<Math.max(...data[key]["valores"]))
max=Math.max(...data[key]["valores"]);
if(min>Math.min(...data[key]["valores"]))
min=Math.min(...data[key]["valores"]);
if(numberValues<data[key]["valores"].length)
numberValues=data[key]["valores"].length;
}
// obtenemos el valor máximo multiplo de 10
var result=max%10;
if(result>0) { max+=10-result;
}
result=min%10;
if(result>0) { min-=result;
}
return [max,min,numberValues];
};
/**
* Funcion para dibujar una linea
* @param {integer} startX
* @param {integer} startY
* @param {integer} endX
* @param {integer} endY
* @param {string} color in html format
* @param {integer} lineWidth Anchura de la linea
*/
Chart.prototype.drawLine=function(startX, startY, endX, endY, color, lineWidth) { this.ctx.strokeStyle = color;
this.ctx.beginPath();
this.ctx.moveTo(startX,startY);
this.ctx.lineTo(endX,endY);
this.ctx.lineWidth=lineWidth;
this.ctx.stroke();
this.ctx.restore();
};
/**
* Función para mostrar el titulo en la parte superior
*/
Chart.prototype.drawTitle=function() { this.ctx.save();
this.ctx.textAlign="center";
this.ctx.fillStyle = "#000000";
this.ctx.font = "bold 24px Arial";
this.ctx.fillText(this.title, this.canvas.width/2,30);
this.ctx.restore();
};
/**
* Función que pone un texto en el canvas en la posicion indicada
* Utiliza el ultimo tamaño y tipo de fuente definido
* @param {string} text
* @param {integer} x
* @param {integer} y
*/
Chart.prototype.drawText=function(text,x,y) { this.ctx.save();
this.ctx.fillText(text, x, y);
this.ctx.restore();
};
/**
* function to print the axis Y numbers and lines
* @param {integer} minValue
* @param {integer} maxValue
* @param {integer} difMaxMin
* @param {integer} graphHeight - height of graph in canvas
* @param {integer} paddingTop - space from top canvas to start graph
*/
Chart.prototype.drawAxisY=function(minValue,maxValue,difMaxMin,graphHeight,paddingTop) { var gridScale = Math.ceil((difMaxMin)/10);
var gridValue = minValue;
var gridY;
while (gridValue <= maxValue){ gridY = (graphHeight * (1 - (gridValue-minValue)/difMaxMin));
if(this.reverseY) { gridY = graphHeight-gridY;
}
gridY+=paddingTop;
this.drawLine(0, gridY, this.canvas.width, gridY, "#e1e1e1", 1);
this.drawText(gridValue, 10, gridY - 2);
gridValue+=gridScale;
}
};
/**
* function to print the axis X numbers and lines
* @param {integer} axisYStart
* @param {integer} axisYEnd
* @param {integer} paddingLeft - space from left canvas to start graph
* @param {integer} barSize
*/
Chart.prototype.drawAxisX=function(axisYStart,axisYEnd,paddingLeft,barSize) { var barIndex = 0;
if(this.dataHorizontal) { // dibujamos los valores del eje X
for(var value of this.dataHorizontal) { var x=paddingLeft+(barIndex*barSize);
if(value) { // si disponemos de texto a mostrar en el eje X, creamos una
// linea vertical atraviesa todo el grafico
this.drawLine(x, axisYStart-5, x, axisYEnd+5, "#e1e1e1", 1);
this.drawText(value, x-(this.ctx.measureText(value).width/2),axisYEnd + 20);
}else if(this.showHorizontalSmallLines){ // si tenemos indicado que muestra unicamente las marcas verticales
this.drawLine(x, axisYEnd-5, x, axisYEnd+5, "#e1e1e1", 1);
}
barIndex++;
};
}
if(this.horizontalText) { // show the title for X bar
this.ctx.font = "bold 14px Arial";
this.drawText(this.horizontalText, this.canvas.width/2-(this.ctx.measureText(this.horizontalText).width/2),this.canvas.height - 5);
}
};
/**
* function to print graph lines
* @param {integer} minValue
* @param {integer} maxValue
* @param {integer} graphHeight
* @param {integer} padding
* @param {integer} paddingLeft - space from left canvas to start graph
* @param {integer} paddingTop - space from top canvas to start graph
* @param {integer} paddingBottom - space from bottom canvas to start graph
* @param {integer} barSize
*/
Chart.prototype.drawChart=function(minValue,maxValue,graphHeight,padding,paddingLeft,paddingTop,paddingBottom,barSize) { var barIndex = 0;
var startY=0;
var color;
var points=[];
var text,x,y;
var dots=[];
for(var key of this.datakeys) { barIndex=0;
color=this.data[key]["color"];
dots=[];
points=[];
for(var i=0;i<this.data[key]["valores"].length;i++) { var value=this.data[key]["valores"][i];
if(barIndex>0) { let endY=Math.round(graphHeight * (value-minValue)/(maxValue-minValue));
if(this.reverseY) { endY = graphHeight-endY;
}
endY=this.canvas.height-padding-paddingBottom-endY
// define the line color
color=this.data[key]["color"];
if(this.data[key]["colorUp"] && startY<endY) { color=this.data[key]["colorUp"];
}else if(this.data[key]["colorDown"] && startY>endY) { color=this.data[key]["colorDown"];
}
this.drawLine(
padding+paddingLeft+((barIndex-1)*barSize),
startY,
padding+paddingLeft+(barIndex*barSize),
endY,
color,
2
);
}
startY=Math.round(graphHeight * (value-minValue)/(maxValue-minValue));
if(this.reverseY) { startY = graphHeight-startY;
}
startY=this.canvas.height-padding-paddingBottom-startY;
x=padding+paddingLeft+(barIndex*barSize);
y=startY;
if(this.data[key]["showTip"] && this.tip) { if(this.data[key]["text"] && this.data[key]["text"].length>=i && this.data[key]["text"][i]) { text=this.data[key]["text"][i];
}else{ text=key+" "+value;
}
dots.push({x:x, y:y, text:text}); }
// Dibujamos las lineas verticales en la barra X
if(!this.dataHorizontal && this.showHorizontalSmallLines) { let x=padding+paddingLeft+(barIndex*barSize);
let y=graphHeight + padding + paddingTop;
this.drawLine(x, y-5, x, y+5, "#e1e1e1", 1);
}
points.push([x,y]);
barIndex++;
}
if(this.data[key]["drawBullet"]) { this.data[key]["drawBullet"].draw(this.ctx,points,this.data[key]["color"]);
}
if(this.tip) { this.tip.setDots(this.canvas,dots);
}
}
};
/**
* class for show tooltip in graph
* @param {string} canvasId it's id for canvas to show tooltip */
function ToolTip(canvasId) {
this.tip=document.getElementById(canvasId);
this.ctxTip = this.tip.getContext("2d");
this.dots=[];
this.canvasGraph;
var that=this;
/**
* Function to set data for tooltip and create event mousemove for show tooltips
* @param {element} canvasGraph to show graph
* document.getElementById("myCanvas");
* @param {array} dots - array of elements with coord to show tooltip in the graph
* {
* {x,y,text},{x,y,text},{x,y,text},...
* }
*/
this.setDots=function(canvasGraph,dots) {
this.canvasGraph=canvasGraph;
this.dots=this.dots.concat(dots);
this.canvasGraph.addEventListener("mousemove",function(e) {
that.handleMouseMove(e);
});
};
}
/**
* Funcion para mostrar el tooltip
* @param {event} e
*/
ToolTip.prototype.handleMouseMove=function(e) {
mouseX=parseInt(e.clientX-(e.clientX-e.offsetX));
mouseY=parseInt(e.clientY-(e.clientY-e.offsetY));
for (var i = 0; i < this.dots.length; i++) {
var dot = this.dots[i];
if(mouseX>(dot.x-5) && mouseX<(dot.x+5) && mouseY>dot.y-5 && mouseY<dot.y+5) {
// mostramos el texto que puede estar en varias lineas
var lineHeight=15;
var lines = dot.text.split('\n');
// definimos anchura y altura del canvas que muestra el tooltip
this.tip.height=lineHeight*lines.length+10;
this.tip.width=Math.max(...lines.map(el=>{return this.ctxTip.measureText(el).width;}))+20;
var rect=this.canvasGraph.getBoundingClientRect();
this.tip.style.left = (dot.x + rect.left + window.pageXOffset - 30) + "px";
this.tip.style.top = (dot.y + rect.top + window.pageYOffset - (lineHeight*lines.length+15)) + "px";
this.ctxTip.clearRect(0, 0, this.tip.width, this.tip.height);
for(var j = 0; j<lines.length; j++) {
this.ctxTip.fillText(lines[j], 10, lineHeight*(j+1));
}
return;
}
}
this.tip.style.left = "-200px";
};
/**
* Class for show legend
* @param {string} legendId
*/
function Legend(legendId) { this.legendId=legendId;
}
/**
* Prototype for draw legend
* @param {array} data
* {
* "texto":{
* color:"...",
* },
* "texto2":{
* color:"...",
* },
* }
*/
Legend.prototype.draw=function(data) { datakeys = Object.keys(data);
if(this.legendId) { var legend = document.getElementById(this.legendId);
var ul = document.createElement("ul"); legend.append(ul);
for (let key of datakeys){ let li = document.createElement("li"); li.style.borderLeft = "24px solid "+data[key]["color"];
li.textContent = key;
ul.append(li);
}
}
}
/**
* Class for print circle in intersections
*/
function BulletCircle() {}
BulletCircle.prototype.draw=function(canvasGraph,points,color) { for (var i = 0; i < points.length; i++) { canvasGraph.beginPath();
canvasGraph.arc(points[i][0],points[i][1],4,0,2 * Math.PI);
canvasGraph.strokeStyle=color;
canvasGraph.fillStyle=color;
canvasGraph.fill();
canvasGraph.stroke();
}
}
/**
* Class for print square in intersections
*/
function BulletSquare() {}
BulletSquare.prototype.draw=function(canvasGraph,points,color) { for (var i = 0; i < points.length; i++) { canvasGraph.beginPath();
canvasGraph.rect(points[i][0]-3,points[i][1]-3,6,6);
canvasGraph.strokeStyle=color;
canvasGraph.fillStyle=color;
canvasGraph.fill();
canvasGraph.stroke();
}
}
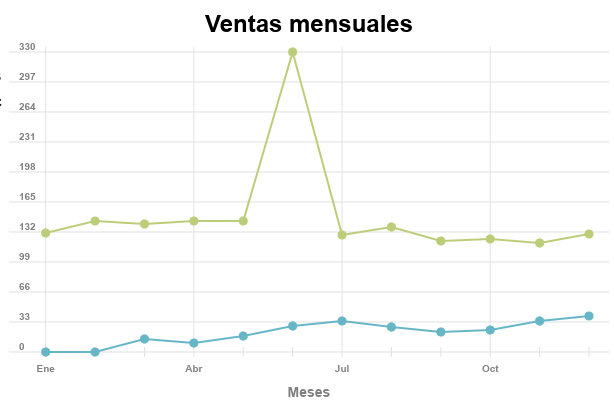
var myCanvas = document.getElementById("myCanvas");myCanvas.width = 600;
myCanvas.height = 400;
var dataGraph = { canvas:myCanvas,
tip:new ToolTip("tip"), legend:new Legend("myCanvasLegend"), title:"Ventas mensuales",
dataHorizontal:["Ene", "", "","Abr","","","Jul","","","Oct","",""],
horizontalText:"Meses",
showHorizontalSmallLines:true,
adjustMin:true,
reverseY:false,
values:{ "Producto B":{ "color":"#67b6c7",
"valores":[0,0,14,10,18,29,34,27,22,24,34,40],
"drawBullet":new BulletCircle(),
"showTip":true
},
"Producto C":{ "color":"#bccd7a",
"valores":[131,144,141,144,144,330,129,138,122,124,120,130],
"drawBullet":new BulletSquare(),
"showTip":true
}
},
};
var myLineChart = new Chart(dataGraph)
myLineChart.draw();
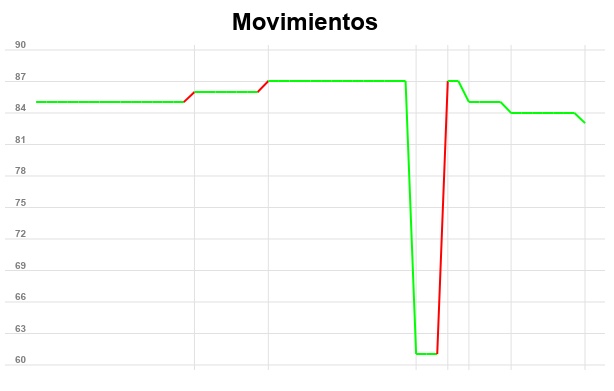
var myCanvas2 = document.getElementById("myCanvas2");myCanvas2.width = 600;
myCanvas2.height = 400;
var dataGraph = { canvas:myCanvas2,
tip:new ToolTip("tip"), legend:new Legend("myCanvasLegend2"), horizontalText:"Movimientos",
showHorizontalSmallLines:true,
adjustMin:true,
values:{ "Producto A":{ "color":"#00ff00",
"colorUp":"#00ff00",
"colorDown":"#ff0000",
"valores":["85","85","85","85","85","85","85","85","85","85","85","85","85","85","85","86","86","86","86","86","86","86","87","87","87","87","87","87","87","87","87","87","87","87","87","87","61","61","61","87","87","85","85","85","85","84","84","84","84","84","84","84","83"],
"drawBullet":false,
"showTip":true
},
},
};
var myLineChart2 = new Chart(dataGraph)
myLineChart2.draw();
</script>


Comentarios sobre la versión: Versión 2.0 (2)