#!/usr/bin/env python
# -*- coding: utf-8 -*-
import pandas_datareader as pdr
from alpha_vantage.techindicators import TechIndicators
from alpha_vantage.sectorperformance import SectorPerformances
import pickle
import os
from tkinter import *
from tkinter import ttk
from tkinter import messagebox, filedialog
from datetime import datetime, timedelta
import matplotlib.pyplot as plt
from matplotlib.figure import Figure
from matplotlib.backends.backend_tkagg import FigureCanvasTkAgg, NavigationToolbar2Tk
import tkinter.scrolledtext as sct
import matplotlib.animation as animation
from matplotlib import style
import numpy as np
if not 'symbols' in os.listdir():
fichero = open('symbols','wb') pickle.dump([],fichero)
fichero.close()
ventana = Tk()
ventana.title("Finan Graph")ventana.geometry("1070x800")ventana.configure(background="light blue")
symbol_entry = StringVar()
time_range = IntVar()
time_range.set(90)
actv = False
used_symbols = pickle.load(open("symbols","rb"))datas = []
selected_items = ["Close"]
info = []
table_head = ""
display_content = ""
styl = ('seaborn-notebook')
styles=['bmh', 'classic', 'dark_background', 'fast', 'fivethirtyeight', 'ggplot', 'grayscale', 'seaborn-bright', 'seaborn-colorblind',
'seaborn-dark-palette', 'seaborn-dark', 'seaborn-darkgrid', 'seaborn-deep', 'seaborn-muted', 'seaborn-notebook', 'seaborn-paper',
'seaborn-pastel', 'seaborn-poster', 'seaborn-talk','seaborn-ticks', 'seaborn-white', 'seaborn-whitegrid', 'seaborn', 'Solarize_Light2',
'tableau-colorblind10', '_classic_test']
style.use(styl)
fig = Figure()
ax1 = fig.add_subplot(111)
ax1.grid()
canvas = FigureCanvasTkAgg(fig,master=ventana)
canvas.draw()
toolbar = NavigationToolbar2Tk(canvas, ventana)
toolbar.update()
canvas.get_tk_widget().pack(side=BOTTOM,fill=BOTH, expand=1)
def select_items(i):
global selected_items
if i not in selected_items:
selected_items.append(i)
buttons[i].configure(bg="light green")
else:
selected_items.remove(i)
buttons[i].configure(bg="gray83")
#print(selected_items)
def activate():
global actv
actv = True
def bands():
global table_head, display_content
try:
ti = TechIndicators(key='MY_API_KEY', output_format='pandas')
BBdata, meta_data = ti.get_bbands(symbol=entry.get(), interval='60min', time_period=60)
table_head = 'BBbands indicator for {} stock (60 min)'.format(entry.get()) more_info.configure(state='normal')
BBdata.plot()
plt.title(table_head)
plt.grid()
display_content = BBdata
plt.show()
except Exception as e:
messagebox.showwarning("ERROR","Información no disponible.")
def get_info():
global actv, datas, info, table_head, display_content
if selected_items != [] and entry.get() != "" and entry3.get() != "" and int(entry3.get()) > 0:
try:
ax1.clear()
ax1.grid()
init_date = datetime.now() - timedelta(days = int(entry3.get()))
info = pdr.get_data_yahoo(entry.get(),start = init_date)
labels = ax1.get_xticklabels()
plt.setp(labels,rotation=45, horizontalalignment='right')
for item in item_list:
if item in selected_items:
datas.append(item)
for i in datas:
ax1.plot(info[i])
ax1.legend((datas),loc='best', shadow=False)
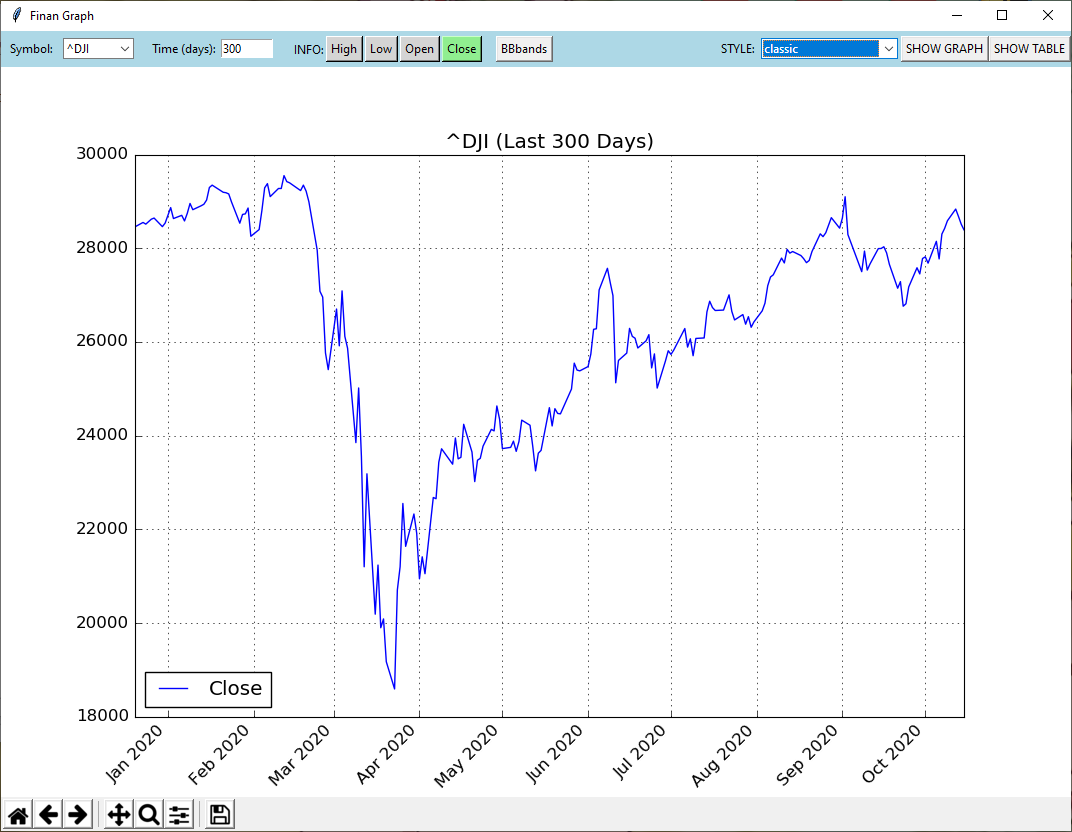
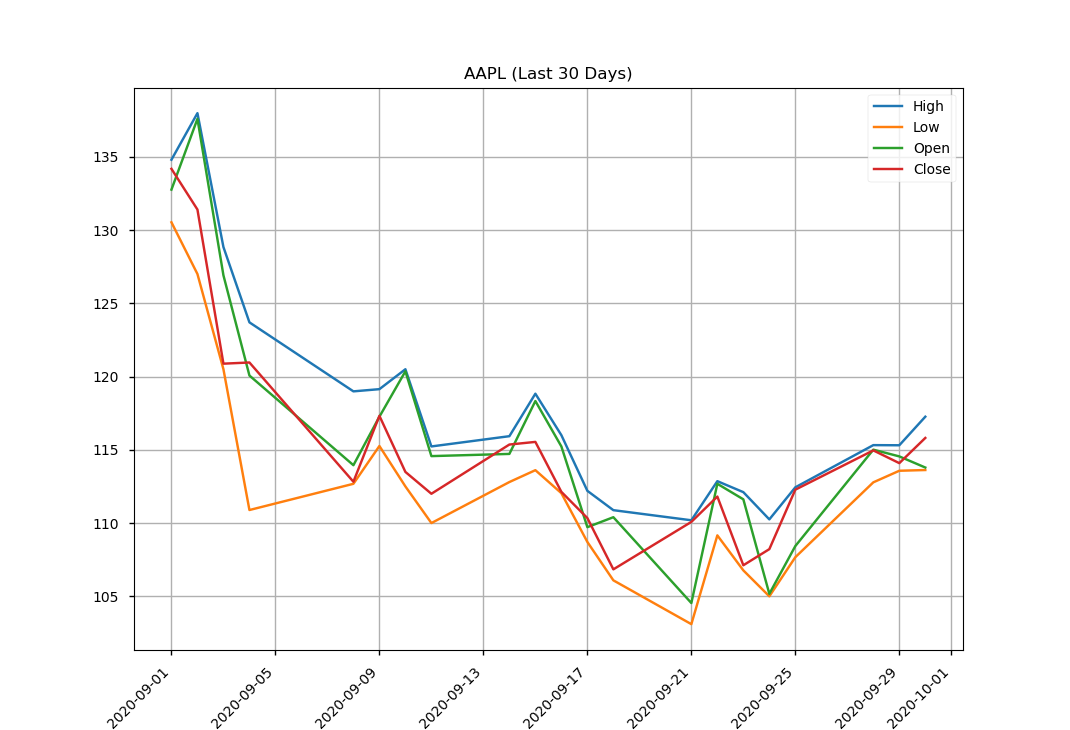
table_head = entry.get()+" (Last "+str(entry3.get())+" Days)"
ax1.set_title(table_head)
update_symbols_file()
display_content = info
more_info.configure(state='normal')
except Exception as e:
messagebox.showwarning("ERROR","ERROR: {}".format(str(e))) else:
messagebox.showwarning("DATOS INSUFICIENTES","Información de entrada insuficiente.") actv = False
datas = []
def sectors_performance():
try:
sp = SectorPerformances(key='YOUR_API_KEY', output_format='pandas')
data, meta_data = sp.get_sector()
data['Rank A: Real-Time Performance'].plot(kind='bar')
plt.title('Real Time Performance (%) per Sector') plt.tight_layout()
plt.grid()
plt.show()
except Exception as e:
messagebox.showwarning("ERROR",str(e))
def update_symbols_file():
if not entry.get() in used_symbols:
used_symbols.insert(0,entry.get())
pickle.dump(used_symbols,open("symbols","wb")) entry["values"]=pickle.load(open("symbols","rb"))
def table():
top = Toplevel()
top.title("INFO TABLE") top.configure(background="light blue")
display = sct.ScrolledText(master=top,width=80)
display.pack(padx=0,pady=0)
display.insert(END,table_head+"\n\n"+str(display_content))
btnSvae = Button(top,text="SAVE TABLE",command=save_table)
btnSvae.pack(side=BOTTOM)
def save_table():
documento = filedialog.asksaveasfilename(initialdir="/",
title="Save",defaultextension='.txt')
if documento != "":
archivo_guardar = open(documento,"w",encoding="utf-8")
lin = ""
content = table_head+"\n\n"+str(display_content)
for i in content:
lin = lin+i
archivo_guardar.write(lin)
archivo_guardar.close()
messagebox.showinfo("GUARDADO","Documento guardado correctamente.")
def represent(i):
global actv
if actv == True:
style.use(entry_styles.get())
get_info()
ani = animation.FuncAnimation(fig, represent, interval=1000)
labelSym = Label(master=ventana,bg="light blue",text="Symbol:",width=8,height=2)
labelSym.pack(side=LEFT)
entry = ttk.Combobox(master=ventana,width=8)
entry["values"]=used_symbols
entry.pack(side=LEFT)
labelRange = Label(master=ventana,text="Time (days):",bg="light blue",width=13,height=2)
labelRange.place(x=135,y=0)
entry3 = Entry(master=ventana,width=8,textvariable=time_range)
entry3.place(x=220,y=8)
more_info = Button(master=ventana,text="SHOW TABLE",state='disabled',command=table)
more_info.pack(side=RIGHT)
graph = Button(master=ventana,text="SHOW GRAPH",command=activate,height=1)
graph.pack(side=RIGHT)
btnTech = Button(master=ventana,text="BBbands",height=1,command=bands)
btnTech.place(x=495,y=5)
btnSectors = Button(master=ventana,text="Sectors Performance",command=sectors_performance)
btnSectors.place(x=560,y=5)
labelInfo = Label(master=ventana,text="INFO:",bg="light blue")
labelInfo.place(x=290,y=8)
btnH=Button(master=ventana,text="High",bg="gray83",command=lambda:select_items("High"))btnH.place(x=325,y=5)
btnL=Button(master=ventana,text="Low",bg="gray83",command=lambda:select_items("Low"))btnL.place(x=364,y=5)
btnV=Button(master=ventana,text="Open",bg="gray83",command=lambda:select_items("Open"))btnV.place(x=399,y=5)
btnC=Button(master=ventana,text="Close",bg="light green",command=lambda:select_items("Close"))btnC.place(x=441,y=5)
entry_styles = ttk.Combobox(master=ventana,state='readonly',width=19)
entry_styles.pack(padx=3,side=RIGHT)
entry_styles.set(styl)
label_styles = Label(master=ventana,text="STYLE:",bg="light blue")
label_styles.pack(side=RIGHT)
entry_styles['values']=styles
item_list=["High","Low","Open","Close"]
buttons = {"High":btnH,"Low":btnL,"Open":btnV,"Close":btnC}
ventana.mainloop()


Comentarios sobre la versión: 1.2 (1)