import java.awt.BasicStroke;
import java.awt.BorderLayout;
import java.awt.Color;
import java.awt.Dimension;
import java.awt.GradientPaint;
import java.awt.Graphics;
import java.awt.Graphics2D;
import java.awt.GridLayout;
import java.awt.Image;
import java.awt.Rectangle;
import java.awt.RenderingHints;
import java.awt.Shape;
import java.awt.Stroke;
import java.awt.event.ComponentEvent;
import java.awt.event.WindowAdapter;
import java.awt.event.WindowEvent;
import java.awt.event.WindowListener;
import java.awt.geom.AffineTransform;
import java.awt.geom.Arc2D;
import java.awt.geom.GeneralPath;
import java.awt.geom.Rectangle2D;
import javax.swing.ImageIcon;
import javax.swing.JComponent;
import javax.swing.JFrame;
import javax.swing.JLabel;
import javax.swing.JPanel;
public class Charts2D extends JFrame {
public Charts2D() { super("2D Charts"); setSize(720, 280);
getContentPane().setLayout(new GridLayout(1, 3, 10, 0));
getContentPane().setBackground(Color.white);
int[] xData = new int[8];
int[] yData = new int[8];
for (int i = 0; i < xData.length; i++) { xData[i] = i;
yData[i] = (int) (Math.random() * 100);
if (i > 0)
yData[i] = (yData[i - 1] + yData[i]) / 2;
}
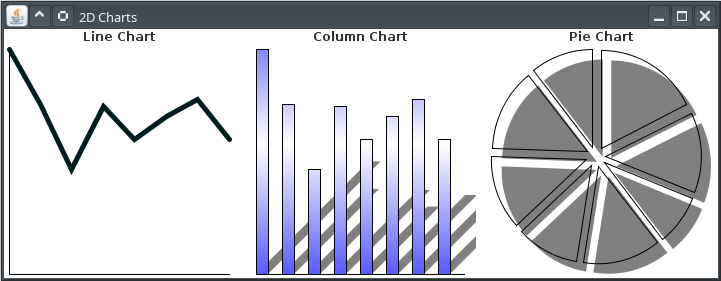
JChart2D chart = new JChart2D(JChart2D.LineChart, xData.length, xData, yData,
"Line Chart");
chart.setStroke(new BasicStroke(5f, BasicStroke.CAP_ROUND,
BasicStroke.JOIN_MITER));
chart.setLineColor(new Color(0, 28, 28));
getContentPane().add(chart);
chart = new JChart2D(JChart2D.ColumnChart, xData.length, xData, yData,
"Column Chart");
GradientPaint gp = new GradientPaint(0, 100, Color.white, 0, 300,
Color.blue, true);
chart.setGradient(gp);
chart.setEffectIndex(JChart2D.Gradientffect);
chart.setDrawShadow(true);
getContentPane().add(chart);
chart = new JChart2D(JChart2D.PieChart, xData.length, xData, yData,
"Pie Chart");
ImageIcon icon = new ImageIcon("largeJava2slogo.GIF"); chart.setForegroundImage(icon.getImage());
chart.setEffectIndex(JChart2D.ImageEffect);
chart.setDrawShadow(true);
getContentPane().add(chart);
WindowListener wndCloser = new WindowAdapter() { public void windowClosing(WindowEvent e) { System.exit(0);
}
};
addWindowListener(wndCloser);
setVisible(true);
}
public static void main(String argv[]) { new Charts2D();
}
}
class JChart2D extends JPanel { public static final int LineChart = 0;
public static final int ColumnChart = 1;
public static final int PieChart = 2;
public static final int PLainEffect = 0;
public static final int Gradientffect = 1;
public static final int ImageEffect = 2;
protected int m_chartType = LineChart;
protected JLabel titleLabel;
protected ChartPanel chartPanel;
protected int dataLength;
protected int[] xData;
protected int[] yData;
protected int xMin;
protected int xMax;
protected int yMin;
protected int yMax;
protected double[] pieData;
protected int m_effectIndex = PLainEffect;
protected Stroke stroke;
protected GradientPaint gradient;
protected Image foregroundImage;
protected Color lineColor = Color.black;
protected Color columnColor = Color.blue;
protected int columnWidth = 12;
protected boolean drawShadow = false;
public JChart2D(int type, int nData, int[] yData, String text) { this(type, nData, null, yData, text);
}
public JChart2D(int type, int nData, int[] xD, int[] yD, String text) { super(new BorderLayout());
setBackground(Color.white);
titleLabel = new JLabel(text, JLabel.CENTER);
add(titleLabel, BorderLayout.NORTH);
m_chartType = type;
if (xData == null) { xData = new int[nData];
for (int k = 0; k < nData; k++)
xData[k] = k;
}
if (yD == null)
throw new IllegalArgumentException("yData can't be null"); if (nData > yD.length)
throw new IllegalArgumentException("Insufficient yData length"); if (nData > xD.length)
throw new IllegalArgumentException("Insufficient xData length"); dataLength = nData;
xData = xD;
yData = yD;
xMin = xMax = 0; // To include 0 into the interval
yMin = yMax = 0;
for (int k = 0; k < dataLength; k++) { xMin = Math.min(xMin, xData[k]);
xMax = Math.max(xMax, xData[k]);
yMin = Math.min(yMin, yData[k]);
yMax = Math.max(yMax, yData[k]);
}
if (xMin == xMax)
xMax++;
if (yMin == yMax)
yMax++;
if (m_chartType == PieChart) { double sum = 0;
for (int k = 0; k < dataLength; k++) { yData[k] = Math.max(yData[k], 0);
sum += yData[k];
}
pieData = new double[dataLength];
for (int k = 0; k < dataLength; k++)
pieData[k] = yData[k] * 360.0 / sum;
}
chartPanel = new ChartPanel();
add(chartPanel, BorderLayout.CENTER);
}
public void setEffectIndex(int effectIndex) { m_effectIndex = effectIndex;
repaint();
}
public int getEffectIndex() { return m_effectIndex;
}
public void setStroke(Stroke s) { stroke = s;
chartPanel.repaint();
}
public void setForegroundImage(Image img) { foregroundImage = img;
repaint();
}
public Image getForegroundImage() { return foregroundImage;
}
public Stroke getStroke() { return stroke;
}
public void setGradient(GradientPaint g) { gradient = g;
repaint();
}
public GradientPaint getGradient() { return gradient;
}
public void setColumnWidth(int c) { columnWidth = c;
chartPanel.calcDimensions();
chartPanel.repaint();
}
public int setColumnWidth() { return columnWidth;
}
public void setColumnColor(Color c) { columnColor = c;
chartPanel.repaint();
}
public Color getColumnColor() { return columnColor;
}
public void setLineColor(Color c) { lineColor = c;
chartPanel.repaint();
}
public Color getLineColor() { return lineColor;
}
public void setDrawShadow(boolean d) { drawShadow = d;
chartPanel.repaint();
}
public boolean getDrawShadow() { return drawShadow;
}
class ChartPanel extends JComponent { int xMargin = 5;
int yMargin = 5;
int pieGap = 10;
int m_x;
int m_y;
int m_w;
int m_h;
ChartPanel() { enableEvents(ComponentEvent.COMPONENT_RESIZED);
}
protected void processComponentEvent(ComponentEvent e) { calcDimensions();
}
public void calcDimensions() { Dimension d = getSize();
m_x = xMargin;
m_y = yMargin;
m_w = d.width - 2 * xMargin;
m_h = d.height - 2 * yMargin;
if (m_chartType == ColumnChart) { m_x += columnWidth / 2;
m_w -= columnWidth;
}
}
public int xChartToScreen(int x) { return m_x + (x - xMin) * m_w / (xMax - xMin);
}
public int yChartToScreen(int y) { return m_y + (yMax - y) * m_h / (yMax - yMin);
}
public void paintComponent(Graphics g) { int x0 = 0;
int y0 = 0;
if (m_chartType != PieChart) { g.setColor(Color.black);
x0 = xChartToScreen(0);
g.drawLine(x0, m_y, x0, m_y + m_h);
y0 = yChartToScreen(0);
g.drawLine(m_x, y0, m_x + m_w, y0);
}
Graphics2D g2 = (Graphics2D) g;
g2.setRenderingHint(RenderingHints.KEY_ANTIALIASING,
RenderingHints.VALUE_ANTIALIAS_ON);
g2.setRenderingHint(RenderingHints.KEY_RENDERING,
RenderingHints.VALUE_RENDER_QUALITY);
if (stroke != null)
g2.setStroke(stroke);
GeneralPath path = new GeneralPath();
switch (m_chartType) { case LineChart:
g2.setColor(lineColor);
path.moveTo(xChartToScreen(xData[0]),
yChartToScreen(yData[0]));
for (int k = 1; k < dataLength; k++)
path.lineTo(xChartToScreen(xData[k]),
yChartToScreen(yData[k]));
g2.draw(path);
break;
case ColumnChart:
for (int k = 0; k < dataLength; k++) { xMax++;
int x = xChartToScreen(xData[k]);
int w = columnWidth;
int y1 = yChartToScreen(yData[k]);
int y = Math.min(y0, y1);
int h = Math.abs(y1 - y0);
Shape rc = new Rectangle2D.Double(x, y, w, h);
path.append(rc, false);
xMax--;
}
if (drawShadow) { AffineTransform s0 = new AffineTransform(1.0, 0.0, 0.0,
-1.0, x0, y0);
s0.concatenate(AffineTransform.getScaleInstance(1.0, 0.5));
s0.concatenate(AffineTransform.getShearInstance(0.5, 0.0));
s0.concatenate(new AffineTransform(1.0, 0.0, 0.0, -1.0,
-x0, y0));
g2.setColor(Color.gray);
Shape shadow = s0.createTransformedShape(path);
g2.fill(shadow);
}
if (m_effectIndex == Gradientffect && gradient != null) { g2.setPaint(gradient);
g2.fill(path);
} else if (m_effectIndex == ImageEffect
&& foregroundImage != null)
fillByImage(g2, path, 0);
else { g2.setColor(columnColor);
g2.fill(path);
}
g2.setColor(lineColor);
g2.draw(path);
break;
case PieChart:
double start = 0.0;
double finish = 0.0;
int ww = m_w - 2 * pieGap;
int hh = m_h - 2 * pieGap;
if (drawShadow) { ww -= pieGap;
hh -= pieGap;
}
for (int i = 0; i < dataLength; i++) { finish = start + pieData[i];
double f1 = Math.min(90 - start, 90 - finish);
double f2 = Math.max(90 - start, 90 - finish);
Shape shp = new Arc2D.Double(m_x, m_y, ww, hh, f1, f2 - f1,
Arc2D.PIE);
double f = (f1 + f2) / 2 * Math.PI / 180;
AffineTransform s1 = AffineTransform.getTranslateInstance(
pieGap * Math.cos(f), -pieGap * Math.sin(f));
s1.translate(pieGap, pieGap);
Shape piece = s1.createTransformedShape(shp);
path.append(piece, false);
start = finish;
}
if (drawShadow) { AffineTransform s0 = AffineTransform.getTranslateInstance(
pieGap, pieGap);
g2.setColor(Color.gray);
Shape shadow = s0.createTransformedShape(path);
g2.fill(shadow);
}
if (m_effectIndex == Gradientffect && gradient != null) { g2.setPaint(gradient);
g2.fill(path);
} else if (m_effectIndex == ImageEffect
&& foregroundImage != null)
fillByImage(g2, path, 0);
else { g2.setColor(columnColor);
g2.fill(path);
}
g2.setColor(lineColor);
g2.draw(path);
break;
}
}
protected void fillByImage(Graphics2D g2, Shape shape, int xOffset) { if (foregroundImage == null)
return;
int wImg = foregroundImage.getWidth(this);
int hImg = foregroundImage.getHeight(this);
if (wImg <= 0 || hImg <= 0)
return;
g2.setClip(shape);
Rectangle bounds = shape.getBounds();
for (int i = bounds.x + xOffset; i < bounds.x + bounds.width; i += wImg)
for (int j = bounds.y; j < bounds.y + bounds.height; j += hImg)
g2.drawImage(foregroundImage, i, j, this);
}
}
}


Comentarios sobre la versión: Versión 1 (0)
No hay comentarios