<!DOCTYPE html>
<html>
<head>
<meta charset="utf-8">
<style>
#myCanvas {
float:left;
background-color:White;
}
legend { font-family:Arial;
font-size:12px;
float:left;
margin-top:50px;
}
legend ul {padding-left:20px;} legend li { list-style:none;
padding:5px;
margin-bottom: 1px;
}
#tip {
background-color:white;
border:1px solid #808080;
position:absolute;
left:-200px;
top:100px;
}
</style>
</head>
<body>
<div>
<canvas id="myCanvas"></canvas>
<legend id="myCanvasLegend"></legend>
<canvas id="tip" width=100 height=25></canvas>
</div>
</body>
</html>
<script>
/**
* Clase para crear el gráfico de barras
* @receive array options
* canvas: objeto canvas
* legendId: id del objeto legend.
* Si no se recibe, no genera la leyenda
* tip: objeto canvas para tooltip
* Si no se recibe, no muestra el tooltip
* data: array de valores del tipo
* {
* "texto":{color:...., valores:[valores], drawBullet:true|false, showTip:true|false},
* "texto2":{color:...., valores:[valores], drawBullet:true|false, showTip:true|false}
* }
* dataHorizontal: array con los valores para el eje horizontal.
* Los valores vacios no se muestran
* Si no se recibe no se muestra y aumenta el tamao del grafico
* ["Ene","","","Abr", ...]
* name: texto. Si no se recibe no se muestra y aumenta el tamaño del grafico
*/
var LineChart = function(options) { this.canvas = options.canvas;
this.legendId = options.legendId;
this.tip = options.tip;
this.data = options.data;
this.dataHorizontal = options.dataHorizontal
this.name = options.name;
this.datakeys = Object.keys(this.data);
this.ctx = this.canvas.getContext("2d"); this.dots=[];
var that=this;
this.draw = function(){ var padding=20;
this.ctx.fillStyle = "#808080";
this.ctx.font = "bold 10px Arial";
// si hay titulo lo mostramos y incrementamos la altura superior del grafico
var paddingTop=paddingBottom=paddingLeft=0;
var paddingRight=10;
if(this.name) { this.drawTitle(this.ctx, this.name);
paddingTop=30;
}
// Si hay valores en el eje horizontal...
if(this.dataHorizontal) { paddingBottom=10;
}
var [maxValue,minValue,numberValues]=this.findGetMaxValue();
// obtenemos la anchura de maxValue con la fuente indicada en this.ctx.font
paddingLeft=this.ctx.measureText(maxValue).width;
var canvasActualHeight = this.canvas.height - padding * 2 - paddingTop - paddingBottom;
var canvasActualWidth = this.canvas.width - padding - 10 - paddingLeft - paddingRight;
var gridScale = Math.ceil((maxValue/10));
///////////////////////////////////////////
// dibujamos el grid y valores del eje Y //
///////////////////////////////////////////
var gridValue = 0;
while (gridValue <= maxValue){ var gridY = canvasActualHeight * (1 - gridValue/maxValue) + padding + paddingTop;
this.drawLine(this.ctx, 0, gridY, this.canvas.width, gridY, "#e1e1e1", 1);
this.drawText(this.ctx, gridValue, 10, gridY - 2);
gridValue+=gridScale;
}
var numberOfBars = numberValues-1;
var barSize = (canvasActualWidth)/numberOfBars;
var barIndex = 0;
/////////////////////////////////////////////////////////
// dibujamos las lineas y valores en el eje horizontal //
/////////////////////////////////////////////////////////
if(this.dataHorizontal)
{ // dibujamos los valores del eje X
for(let value of this.dataHorizontal)
{ let x=padding+paddingLeft+(barIndex*barSize);
let yStart=padding + paddingTop;
let yEnd=canvasActualHeight + padding + paddingTop;
if(value)
{ // si disponemos de texto a mostrar, la linea vertical atraviesa todo el grafico
this.drawLine(this.ctx, x, yStart-5, x, yEnd+5, "#e1e1e1", 1);
this.drawText(this.ctx,value, x-(this.ctx.measureText(maxValue).width/2),yEnd + 20);
}else{ this.drawLine(this.ctx, x, yEnd-5, x, yEnd+5, "#e1e1e1", 1);
}
barIndex++;
};
}
//////////////////////////////////////
// dibujamos las lineas del grafico //
//////////////////////////////////////
for(let key of this.datakeys)
{ barIndex = 0;
var startY=0;
var color=this.data[key]["color"];
var points=[];
for(let value of this.data[key]["valores"])
{ if(barIndex>0)
{ this.drawLine(
this.ctx,
padding+paddingLeft+((barIndex-1)*barSize),
startY,
padding+paddingLeft+(barIndex*barSize),
this.canvas.height-padding-paddingBottom-Math.round(canvasActualHeight * value/maxValue),
color,
2
);
}
startY=this.canvas.height-padding-paddingBottom-Math.round(canvasActualHeight * value/maxValue);
let x=padding+paddingLeft+(barIndex*barSize);
let y=startY;
if(this.data[key]["showTip"]) { this.dots.push({x:x, y:y, w:x, h:y, value:value, text:key}); }
points.push([x,y]);
barIndex++;
}
if(this.data[key]["drawBullet"]) { this.drawBullet(this.ctx,points,color);
}
}
this.drawLegend();
}
/**
* Funcion para mostrar el tooltip
*/
this.handleMouseMove=function(e){ mouseX=parseInt(e.clientX-(e.clientX-e.offsetX));
mouseY=parseInt(e.clientY-(e.clientY-e.offsetY));
for (let i = 0; i < this.dots.length; i++) { let dot = this.dots[i];
if(mouseX>dot.x-5 && mouseX<dot.w+5 && mouseY>dot.y-5 && mouseY<dot.h+5)
{ let rect=this.canvas.getBoundingClientRect();
this.tip.style.left = (dot.x + rect.left - 20) + "px";
this.tip.style.top = (dot.y + rect.top - 20) + "px";
this.ctxTip.clearRect(0, 0, this.tip.width, this.tip.height);
this.ctxTip.textAlign="center";
this.ctxTip.fillText(dot.text+" "+dot.value, 50, 15);
return;
}
}
this.tip.style.left = "-200px";
}
if(this.tip)
{ // evento para mostrar el tooltip
this.ctxTip = this.tip.getContext("2d"); this.canvas.addEventListener("mousemove",function(e){that.handleMouseMove(e);}); }
/**
* Function que devuelve el elemento mas grande, pequeño y cantidad de elementos
* de todos los valores recibidos para el grafico
*/
this.findGetMaxValue=function(){ var max=0;
var numberValues=0;
var min=Number.MAX_SAFE_INTEGER;
for(let key of this.datakeys)
{ if(max<Math.max(...this.data[key]["valores"]))
max=Math.max(...this.data[key]["valores"]);
if(min>Math.min(...this.data[key]["valores"]))
min=Math.min(...this.data[key]["valores"]);
if(numberValues<this.data[key]["valores"].length)
numberValues=this.data[key]["valores"].length;
}
// obtenemos el valor máximo multiplo de 10
var result=max%10;
if(result>0)
max+=10-result;
return [max,min,numberValues];
}
/**
* Funcion para dibujar una linea
* @receive element ctx
* @receive integer startX
* @receive integer startY
* @receive integer endX
* @receive integer endY
* @receive string color in html format
*/
this.drawLine=function(ctx, startX, startY, endX, endY, color, lineWidth) { ctx.save();
ctx.strokeStyle = color;
ctx.beginPath();
ctx.moveTo(startX,startY);
ctx.lineTo(endX,endY);
ctx.lineWidth=lineWidth;
ctx.stroke();
ctx.restore();
}
/**
* Funcion para dibujar los puntos redondos en cada intersección
* @receive element ctx
* @receive array points array of points with positions X,Y [[20,12], [15,42], ...]
* @receive string color
*/
this.drawBullet=function(ctx,points,color) { for (let i = 0; i < points.length; i++) { ctx.beginPath();
ctx.arc(points[i][0],points[i][1],4,0,2 * Math.PI);
ctx.strokeStyle=color;
ctx.fillStyle=color;
ctx.fill();
ctx.stroke();
}
}
/**
* Función para mostrar el titulo en la parte superior
*/
this.drawTitle=function(ctx,text) { ctx.save();
ctx.textAlign="center";
ctx.fillStyle = "#000000";
ctx.font = "bold 24px Arial";
ctx.fillText(text, this.canvas.width/2,30);
ctx.restore();
}
/**
* Función que pone un texto en el canvas en la posicion indicada
* Utiliza el ultimo tamaño y tipo de fuente definido
* @receive element ctx
* @receive string text
* @receive integer x
* @receive integer y
*/
this.drawText=function(ctx,text,x,y) { this.ctx.save();
this.ctx.fillText(text, x, y);
this.ctx.restore();
}
/**
* Dibujamos la leyenda en el id recibido en los parametros
*/
this.drawLegend=function() { if(this.legendId) { var legend = document.getElementById(this.legendId);
var ul = document.createElement("ul"); legend.append(ul);
for (let key of this.datakeys){ let li = document.createElement("li"); li.style.borderLeft = "24px solid "+this.data[key]["color"];
li.textContent = key;
ul.append(li);
}
}
}
}
var myCanvas = document.getElementById("myCanvas");var myTip = document.getElementById("tip");myCanvas.width = 600;
myCanvas.height = 400;
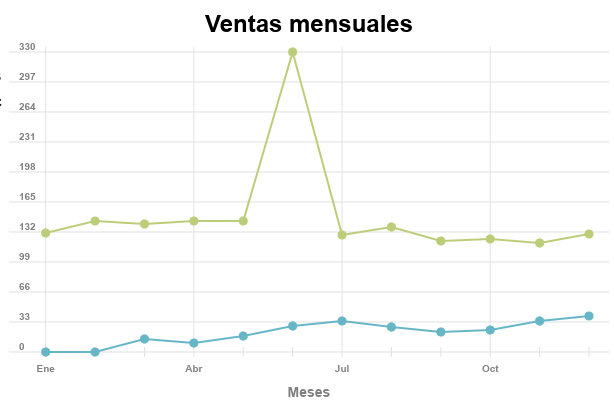
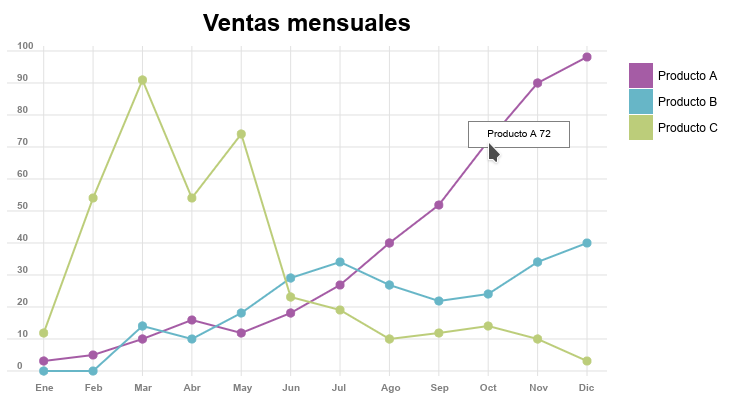
var dataHorizontal = ["Ene", "Feb", "Mar","Abr","May","Jun","Jul","Ago","Sep","Oct","Nov","Dic"];
var data = { "Producto A":{ "color":"#a55ca5",
"valores":[3,5,10,16,12,18,27,40,52,72,90,98],
"drawBullet":true,
"showTip":true
},
"Producto B":{ "color":"#67b6c7",
"valores":[0,0,14,10,18,29,34,27,22,24,34,40],
"drawBullet":true,
"showTip":true
},
"Producto C":{ "color":"#bccd7a",
"valores":[12,54,91,54,74,23,19,10,12,14,10,3],
"drawBullet":true,
"showTip":true
}
};
var myLineChart = new LineChart(
{ canvas:myCanvas,
tip:myTip,
legendId:"myCanvasLegend",
data:data,
dataHorizontal:dataHorizontal,
name:"Ventas mensuales",
}
);
myLineChart.draw();
</script>